The end of “US exceptionalism” as an investment narrative, the value on offer in EM, and the potential for these maligned markets to enter a virtuous circle of performance are themes that we have been banging on about for months now.
While the unwinding of the “Trump trade” was in keeping with our outlook published to investors in past months, we clearly did not anticipate how the chaotic imposition of tariffs on “Liberation Day” would serve as such a potent accelerant.
This was a radical outcome
Markets expected a gradual and predictable rollout of tariff measures, but what we got was random and unpredictable. The economic fallout, should the 90-day tariff reprieve fail to yield de-escalation, will hit the United States harder than most other countries as the affected share of GDP is much higher. US goods imports alone are equivalent to c.11.5% of US GDP versus total bilateral trade (exports plus imports) with the US of 3.5–5.5% of respective GDPs in Japan, Europe and China.
Exports plus imports of goods as % of GDP
US – total, others – bilateral with US

Source: NS Partners and LSEG Datastream.
Unless there is a dramatic reversal, a return to protectionism threatens a supply shock in the United States, which will drive the price of many things higher and create shortages for many basic goods. This will be destructive for demand and ultimately deflationary unless the Fed accommodates the shock by increasing the money supply.
What is the tariff endgame?
Is President Trump willing to risk a financial crisis in the pursuit of reindustrialising America? Or is this all in the “Art of the Deal,” a negotiating tactic designed to secure better trade terms? Or is it about completely decoupling from and isolating China?
Uncertainty over the outcome sought, the potential fallout from American businesses pausing investment and consumers reining in spending are undermining sentiment for all US assets.
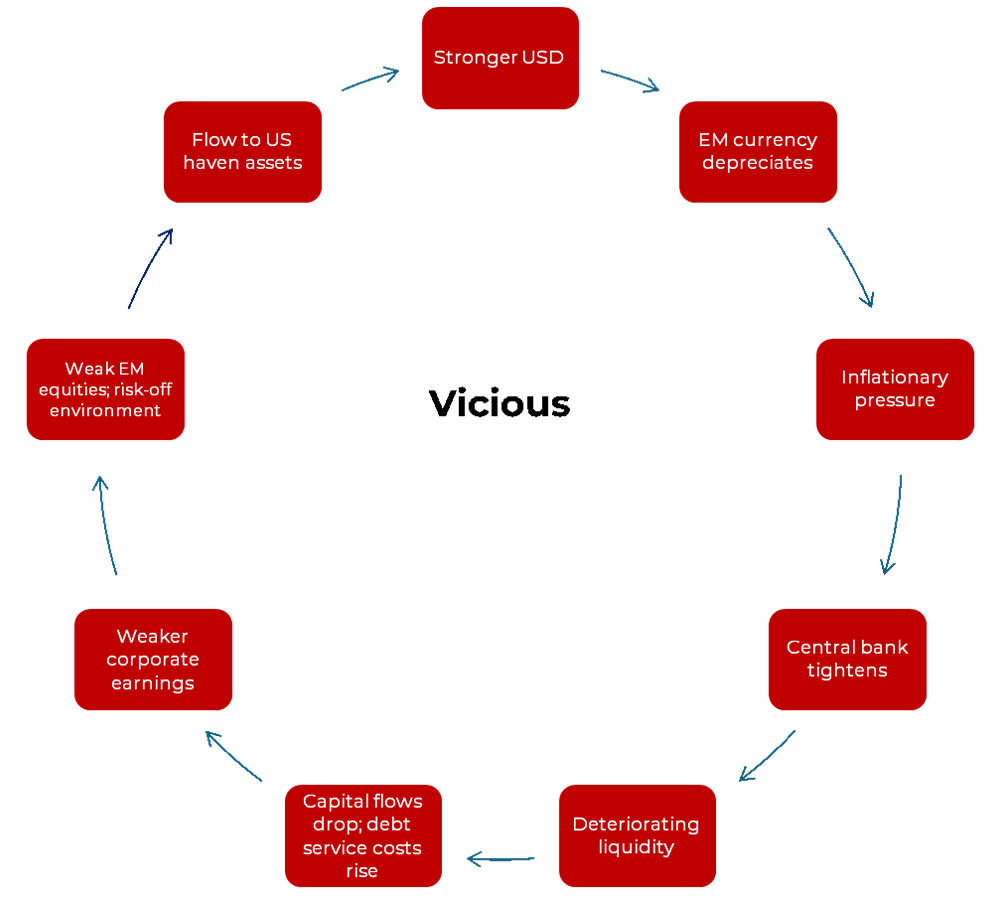
The soft economic underbelly of the United States is being exposed. Liberation Day saw the dollar falling along with bond and equity markets. This is how emerging markets are meant to behave on political risks spiking, and not the global market safe haven.
If Trump truly seeks a dramatic reduction in the US trade deficit, this will be accompanied by a reduction in the capital account surplus, meaning that foreign investors do not need to buy the same quantum of US assets as before.
The trouble is that a falling capital account surplus as foreigners repatriate funds (or simply invest less in US assets) puts upward pressure on government bond yields. It was persistent demand for US Treasuries irrespective of the fiscal profligacy of the government that allowed it to build up a debt pile of $36 trillion, with $9 trillion of that due to be refinanced this year.
So President Trump wants a weaker dollar to boost domestic manufacturers, but what to do about yields? The most simple solution will be financial repression, by forcing domestic financial institutions to increase their holdings of US Treasuries. Where do the funds come from for these purchases – from selling US equities perhaps?
The damage is done
Course corrections were inevitable. As former President Clinton’s political advisor James Carville famously said:
“I used to think that if there was reincarnation, I wanted to come back as the President or the Pope or as a .400 baseball hitter. But now I would want to come back as the bond market. You can intimidate everybody.”
President Trump backed down in the face of spiking bond yields with his 90-day tariff pause to everyone but China, but it is likely that damage has been done here that cannot be undone.
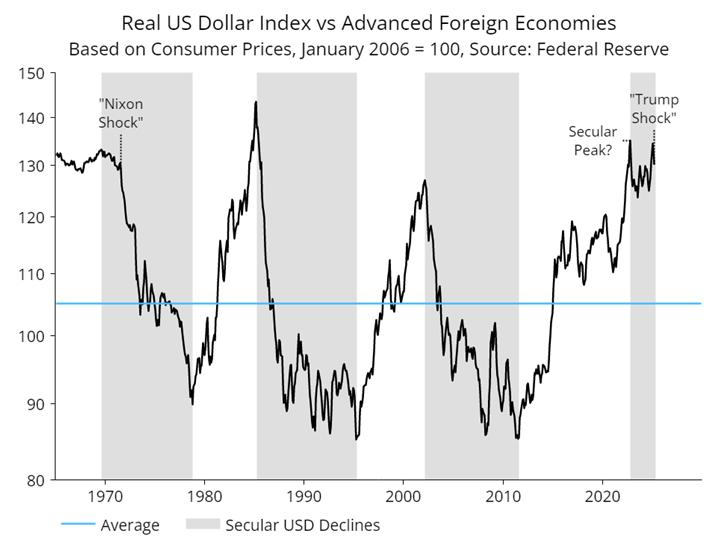
We may be in the early innings of a broader secular shift in markets. Our economist Simon Ward has asked whether this will be similar in magnitude to the dollar bear market sparked by President Nixon’s suspension of gold convertibility and imposition of tariffs in 1971.
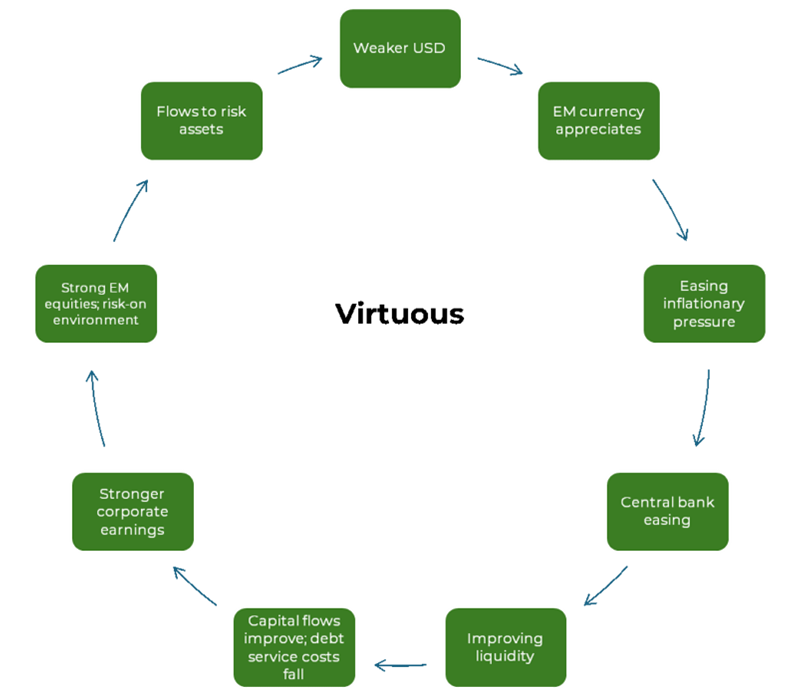
While this could signal a rocky period ahead for US equities, a falling dollar flushes emerging markets with managed currency regimes with liquidity and allows central banks to cut rates.
Historically, this has been a good signal and driver of EM outperformance.
EM relative performance and USD
Source: NS Partners and LSEG Datastream.
Expect some unsettling trade headlines in the months ahead, but things could start to get very interesting for emerging markets fuelled by a falling dollar.
Portfolio strategy notes
High level
Tariffs will be deflationary if central banks do not accommodate them – see Smoot-Hawley tariffs in the 1930s which were massively deflationary. Compare and contrast the inflationary oil price shock in 1973 where the central bank accommodated, and the second oil price shock in 1979 which was not inflationary as the Fed under Volcker kept monetary policy tight. We do not expect Powell to accommodate.
It is likely that this will be a very deflationary event for the rest of the world as supply is diverted from the United States elsewhere resulting in downward pressure on rates.
We were already relatively defensively positioned as money trends were suggesting a Q2/Q3 economic slowdown before trade war shock – this will be negative for US growth. Our expectation is for a short, sharp economic shock, but not a crisis (based on our cycles analysis).
Strategy
- Inflation boost from tariffs expected to be small/temporary – monetary backdrop still disinflationary
- Relative money trends positive for China/EM
- Excess money backdrop neutral/negative
- Favour more defensive exposure – underweight oil and commodities
- Favour interest rate sensitive countries and companies
- Falling dollar beneficiaries
- Highly cyclical markets downgraded – especially consumer cyclical exposure
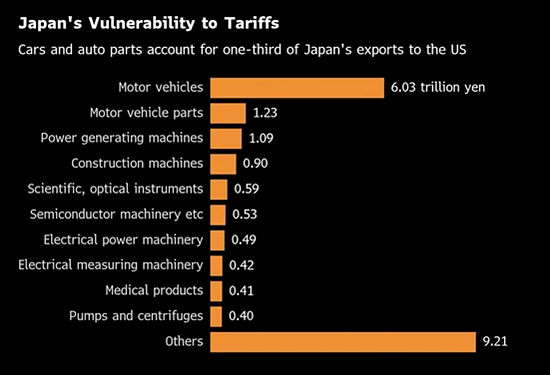
- Avoid exporters with high exposure to the United States
- China consumer – stimulus to step up as tariff response