
Connor, Clark & Lunn Infrastructure is featured in Green Street’s examination of renewed investor interest in freight rail as US supply chains are re‑engineered for resilience and efficiency. Green Street underscores the role of rail infrastructure in supporting long‑term industrial competitiveness, while highlighting the view that essential, hard‑asset businesses with strong fundamentals remain well positioned to benefit from these structural shifts – a view that CC&L Infrastructure, owner of Alpenglow Rail, shares.
“More manufacturing in the Americas is going to create more opportunity for rail. It just will,” said Ryan Lapointe, Managing Director, Connor, Clark & Lunn Infrastructure. “Anybody who’s manufacturing product in significant volume is going to need access to rail,” he continued, highlighting the role of rail in “resilient” supply chains.
The full article by Matt O’Brien, Journalist, Green Street is below.
Freight rail in vogue as US retools industrial supply chains
Originally published on March 26, 2026
Freight rail, particularly short-haul rail, is seen as a key part of fortifying the US’s ongoing reindustrialization.
Last year, US manufacturing construction spending hit historically high levels of roughly $223 billion, more than double what 2021 registered, according to Brightsmith, an executive search firm in the clean energy manufacturing industry.
New factories for computer chips, batteries, EVs, pharmaceuticals, and data centers are largely driving, arguably, the reshoring and, certainly, the rebuilding of industry, with investors and policymakers hoping such efforts eventually bring back an era reminiscent of mid-20th-century American manufacturing might.
“From our standpoint, we’ve seen some successful movement on reshoring, and see the need for a more resilient global supply chain framework for reliably moving goods,” said Matthew Brand, COO and head of capital markets at ITE Management, an alternative asset manager focused on critical transportation equipment. “Depending on the businesses that get reshored, we may see more intermediate and final assembly than full scale manufacturing.”
For infrastructure investors, the shift to reshoring and recalibrating supply chains – accelerated by post-COVID vulnerabilities and reinforced by the Trump administration’s tariffs – means favoring assets with contracted, diversified cash flows that sit at the new nodes of a more “atomized” North American network, industry participants said in interviews.
Brand identified rails, containers, chassis and trailers – though executives said rail could stand to benefit the most.
“More manufacturing in the Americas is going to create more opportunity for rail. It just will,” said Ryan Lapointe, managing director at Connor, Clark & Lunn Infrastructure, which owns the Alpenglow Rail platform of six rail terminals in key industrial markets. “Anybody who’s manufacturing product in significant volume is going to need access to rail.”
Connor, Clark & Lunn closed a private-placement debt deal for Alpenglow late last year at attractive spreads, citing the platform’s blue-chip customer base, full-suite transloading services and role in “resilient” supply chains. The use of proceeds included capacity for organic growth and M&A, both of which remain active pipelines.
The US Surface Transportation Board’s push to streamline regulation, with faster environmental reviews and potential categorical exclusions that could reduce project costs and timelines, comes at an ideal time and could foster marginal activity that otherwise may not materialize.
Loosening regulation and changing economic patterns mean short-haul railroads and intermodal terminals stand to gain disproportionately as components and sub-assemblies move multiple times between suppliers in a reshored or nearshored environment, rather than arriving in bulk at a handful of gateway ports.
John Porcari, managing director at lnvestcorp Corsair Infrastructure Partners, pointed to that pattern exactly.
“I know there’s a lot of attention on the class one railroads and there should be, but I’d also look at the short haul railroads where they may be a more important part of the supply chain with components and subcomponents than they were in the past. … the same applies to trucking as well,” he said.
Sophisticated original equipment manufacturers, including those in automotive and aerospace, are still mapping their tertiary suppliers and realizing that onshoring assembly does not mean onshoring the components, executives said. The result: more east-west, north-south and even intra-regional movements that favor flexible, rail-linked distribution.
Re/on/near shoring
Those interviewed attested that the reshoring of industry back to the US has been a mixed picture. But for certain businesses that have come back to North America, some assets are seen as central to those changes.
Ports themselves are not being left behind, but the focus is shifting. Cesar Valero Mendoza, partner at ALG, a transportation-infrastructure consultancy, said interest remains high for new or expanded container terminals on the Gulf of Mexico aimed squarely at nearshoring volumes – smaller than traditional international gateways but aligned with rising Mexican manufacturing.
Mexico’s established Tier 1-2-3 supplier base and productivity edge versus Asia, even under higher tariffs, continue to support the case, Valero added.
“Mexico turns out to be more competitive or gains some competitiveness versus Asia,” he said.
Cold storage at inland intermodal nodes, expanded short-haul rail spurs and leasing platforms that can scale with OEM assembly growth are among the more immediately investible pockets, executives said.
Technological tailwinds are also emerging. Mendoza flagged autonomous-truck corridors and dedicated logistics zones as likely developments within five years, driven by persistent driver shortages.
Meanwhile, the Al data center boom is amplifying these logistics tailwinds. Massive power demand growth – the first sustained increase in 25 years after decades of flat load – and the need for construction materials and equipment are boosting rail and intermodal volumes, particularly in the Southeast and Gulf Coast, where reshoring manufacturing and digital infrastructure are converging.
Morgan Stanley Infrastructure Partners sees “bullish pulls” in the Gulf and Southeast from power demand driven by both data centers and reshoring activity, said managing director and head of Americas Chris Ortega.
“So I think reshoring, as opposed to nearshoring, in areas that have overall robust growth for a variety of factors, including reshoring, are the places where we’re going to leg in and express that point of view,” he said. “The ability to diligence the duration or the specific impacted trade routes for international trade volumes due to tariffs and geopolitical events is challenging – and I’m not sure how one does that with conviction over a five-plus-year perspective.”
Tom Murray, managing partner at Power Sustainable Infrastructure Credit, agreed.
He sees reshoring creating broad incremental infrastructure demand.
“If you’re going to reshore things … there’s going to be an incremental need for more infrastructure to support that,” Murray said, explicitly including transport and logistics.
With governments facing deficits and competing priorities such as military spending, private capital – including direct lending – is expected to fill more of the gap.
“Private capital is out there looking to put money to work in reasonable risk-return opportunities,” Lapointe said. “Where things are going to struggle to get built is where there is no reasonable risk-return opportunity.”
In a world where geopolitics and trade are becoming fractured and more uncertain, investors may find stability for projects supporting reindustrialization by harnessing long-term public-private partnership financing arrangements, Porcari said.
“Certainly, uncertainty can be priced into the financing and contracts,” he said. “In fact, we are beginning to see tariff clauses written into P3 contracts.”
Congress will adjudicate on STB’s authorization renewal at the end of this year, presenting policymakers an opportunity to tweak legislation for federal loan programs, like the Transportation Infrastructure Finance and Innovation Act and Railroad Rehabilitation and Improvement Financing Program, so that more assets are eligible for such funding, added Porcari, who was port envoy for the Biden-Harris Administration’s Supply Chain Disruptions Task Force and deputy secretary and COO of the US Department of Transportation under President Obama.
Last week, the federal government and its private-sector partners announced huge P3 deals in the power sector – a 10GW gas-fired power generation project with NextEra Energy and a $4.2 billion high-voltage electric transmission initiative with AEP Ohio.
Meanwhile, those who cannot build are buying.
M&A pipelines in rail terminals and related logistics assets remain active, with disciplined buyers waiting for the right fit with existing customer footprints. About eight deals have been announced over the past 15 months, according to various trade news publications covering the sector.
Major Class I railroad mergers are rare due to strict STB oversight, while short-hauls occur only slightly more frequently. Between 2021-2025, each year averaged roughly one to three deals annually, except for 2025, when around six were closed, according to the same sources.
Some of the more notable deals from the last 12 months have been FTAI Infrastructure’s acquisition of Class II Wheeling & Lake Erie Railway in August 2025; Canadian National clinching its deal for Iowa Northern Railway in January 2025; Union Pacific Corporation’s mammoth $85 billion deal for Norfolk Southern Corporation, creating America’s first transcontinental railroad; among others.
A couple of weeks ago, Ridgewood Infrastructure acquired a controlling interest in Sierra Railroad Company, a California-based shortline rail platform – a move that was seen as expanding the platform’s strategic access to key dairy, agricultural, and industrial corridors, as well as interchanges with Union Pacific and BNSF Railway.
Shrugging off SCOTUS tariff ruling
And while the STB is pursuing a more growth-oriented regulatory environment, government also clouded the reshoring narrative when the US Supreme Court struck down the president’s legal justification for his tariff policy.
Yet, private sector executives doubt that move will kibosh reshoring.
Murray said the Supreme Court decision is unlikely to derail the reshoring trend, as national security and supply-chain resilience remain the primary drivers.
“Even with the recent SCOTUS tariffs decision removing or reducing some of the barriers to importing products, the incentives to encourage reshoring, such as federal loan and grant programs, as well as local and state economic incentives, remain,” Porcari said. “The Supreme Court has taken away a primary stick to encourage reshoring, but the carrots remain.”
Reprinted with permission from the author.


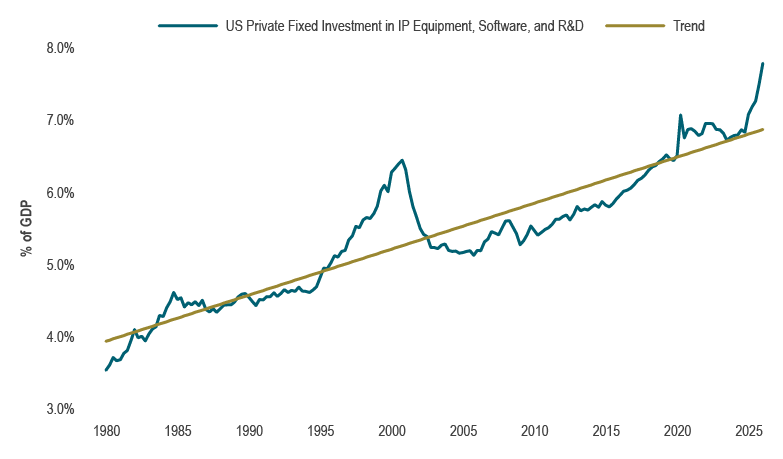 Source: US Bureau of Economic Analysis, Macrobond
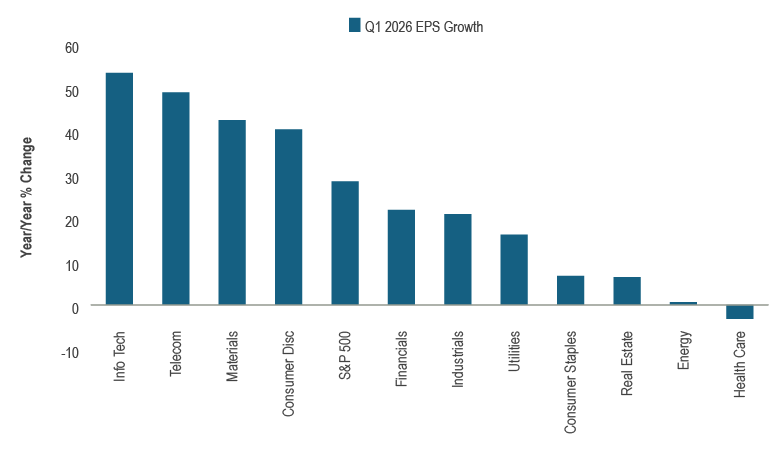 Source: FactSet. Note: As of May 21, 2026
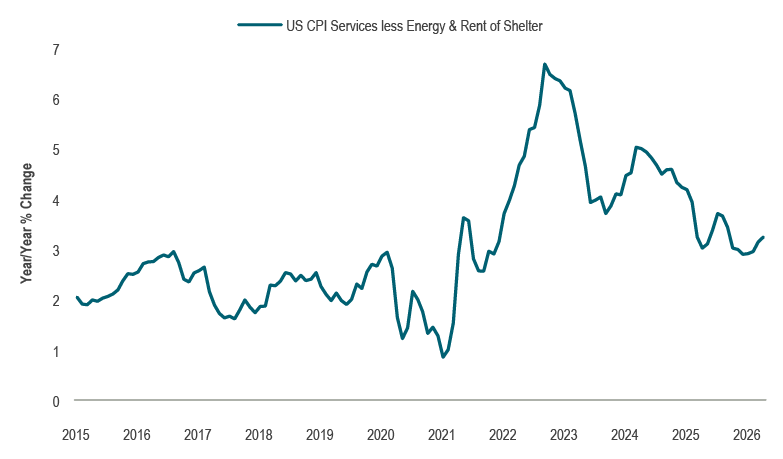 Source: US Bureau of Labor Statistics, Macrobond
 Source: US Bureau of Labor Statistics, Macrobond