Investors have long been attracted to emerging market equities for their growth potential and unique investment opportunities. However, consideration of emerging market opportunities in fixed income has been less common. You may be surprised by the investment case for emerging markets credit and how an allocation can contribute to portfolio diversification and enhanced returns, as explored in this article.
Emerging markets credit refers to the debt securities issued by corporations and sovereign entities domiciled in emerging economies. The debt is denominated in either the ‘local’ currency of the issuer, or in currency of a developed market, such as the US dollar, which is referred to as external or ‘hard’ currency credit. Like their developed market counterparts, a credit rating is assigned to distinguish between investment grade and non-investment grade (high yield) debt.
Some of the key attributes of emerging markets credit include:
- Large, diversified asset class: combined market value of emerging market local and external currency sovereign and corporate issuers is greater than the US treasury market.
- Higher yield: can provide a spread premium over comparably rated, developed market
- Less levered: borrowers are generally less levered than borrowers in developed markets
at a similar credit rating. - Lower default experience: default experience has been at a lower rate than comparably rated, developed markets
- Diversification merits: low correlation to developed markets credit due to economic cycles and market dynamics being different from those of developed markets provides diversification benefits.
Size of Market
The size of the emerging markets credit issuance may surprise many investors, especially when including both the local and external currency sovereign and corporate market, which when taken together has a market value greater than US treasuries (Figure 1).
Figure 1 – Major Fixed Income Markets
| Major Fixed Income Markets | Opportunity Set ($B) |
|---|---|
| US Treasuries | $23,900 |
| Other Developed markets Sovereigns | $14,700 |
| Emerging markets local currency sovereigns | $11,100 |
| Emerging markets local currency corporates | $10,700 |
| US Agency Mortgage Backed Securities | $8,400 |
| US Investment Grade | $7,800 |
| Emerging markets external currency corporates | $2,500 |
| Emerging markets external currency sovereigns | $1,500 |
| US High Yield | $1,400 |
Source: JP Morgan
Emerging markets local currency sovereign and corporate credit have the largest market value. From the perspective of the borrower, the issuance of local currency debt recognizes that if a country has significant debt, say in US dollars, and its currency falls relative to the US dollar, the debt becomes more costly to pay back. However, the issuance of external currency debt can help diversify funding sources by allowing the emerging market countries to tap into international capital markets.
From the perspective of an asset manager, the added benefit from investing in emerging markets external currency credit, both sovereign and corporate, is it can help manage the risks associated with local exchange rate fluctuations. Moreover, emerging markets external currency credit is generally governed by New York or UK law, whereas emerging markets local currency credit is subject to the specific laws of the issuing emerging market country. Emerging markets external currency credit also offers a more diversified universe of investment opportunities. The focus of the balance of this article is therefore on emerging markets external currency credit.
Transformation of the Investment Landscape
There has been a significant transformation in the emerging markets credit landscape. In the early 1990s, the indices consisted of just 10 countries and had a heavy bias to Latin American economies. Today, there is a much healthier universe of countries, and unlike the equity market index whose market capitalization is dominated by a small number of countries, the sovereign and corporate credit indices are much more diversified in terms of country representation (Figure 2).
Figure 2 – Emerging Markets Sovereign and Corporate Credit Index
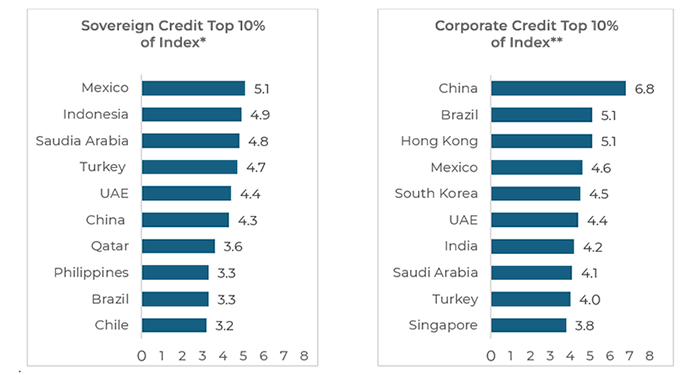
*JP Morgan EMBI Global Diversified Index **JP Morgan CEMBI Broad Diversified Index
Source: JP Morgan, Bloomberg
There has also been a healthy annual issuance of emerging markets credit, with corporate issuance tending to be a larger component of the issuance compared to sovereign credit (Figure 3).
Figure 3 – Emerging Markets Credit Issuance
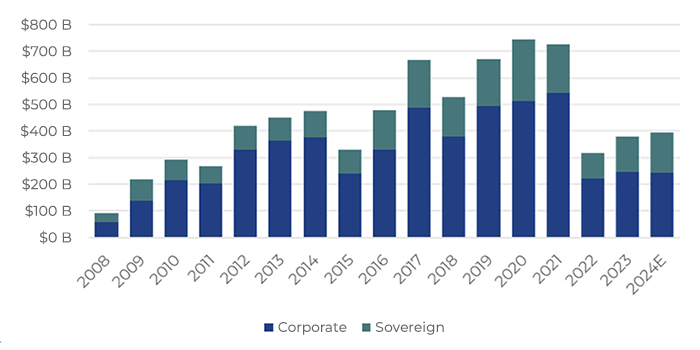 Source: JP Morgan & FortWood Capital
Key Merits of Emerging Markets Credit
Higher yield: emerging markets credit market offers a spread premium over comparably rated developed markets peers due to perceived higher risks. Currently emerging markets offer some of the highest yields since the global financial crisis (Figure 4).
Figure 4 – Emerging markets credit yield vs. US 10-year treasuries
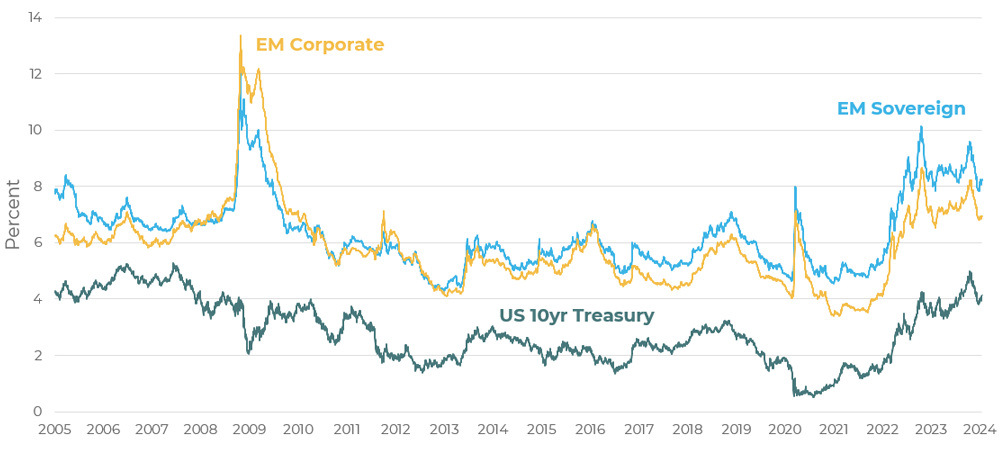 Note: EM Sovereign Index – EMBI Global Diversified, EM Corporate Index – CEMBI Broad Diversified
Source: JP Morgan, Bloomberg
Emerging markets are often susceptible to political and economic volatility. Changes in government, policy shifts, and geopolitical tensions can impact the creditworthiness of issuers. Sovereign credit also tends to have a longer duration (sensitivity to interest rate changes) and when combining these factors has led to emerging markets sovereign credit generally offering higher yields than emerging markets corporate credit.
Less levered: the perceived risk of emerging markets credit is not always justified despite the higher yield. For example, emerging markets corporate issuers, both investment grade and high yield, carry less debt relative to their ability to generate cashflow to service that debt, and are less levered than developed markets borrowers at the same credit rating (Figure 5). Despite carrying less leverage, emerging markets bonds have generally provided higher yields to investors for the same credit rating.
Figure 5 – Net Leverage Comparison
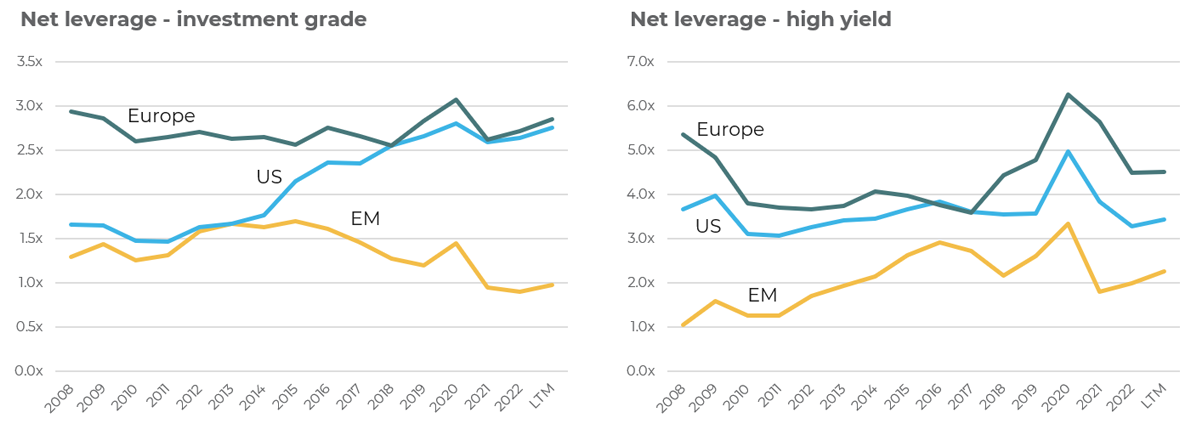 Source: JP Morgan (as of 2023) & FortWood Capital
Lower default experience: emerging markets issuers have historically defaulted at a lower rate than comparably rated developed markets peers (Figure 6). Many emerging markets exhibit robust economic growth, which can support the creditworthiness of issuers. For example, higher economic growth can increase corporate revenues, making the repayment of debt easier.
Figure 6 – Emerging markets corporates default less than developed markets peers
Average 10 year cumulative default rate (1981-2020)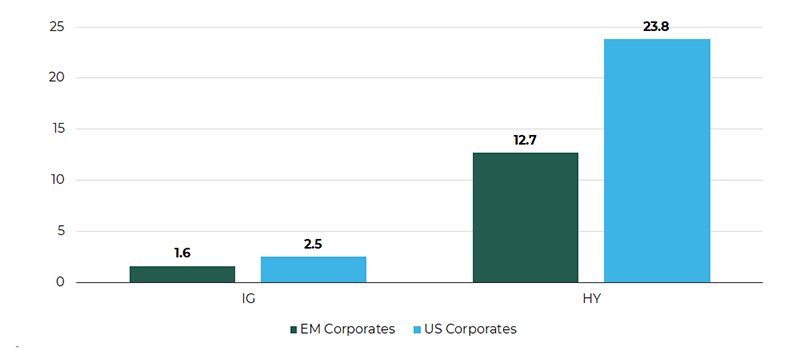 Source: S&P Global Ratings Research & FortWood Capital
Diversification merits: the economic cycles and market dynamics of emerging market countries often differ from those of developed markets. The different experience reduces the correlation, thereby providing a source of portfolio diversification. Investing across different countries, sectors, and issuers can reduce the impact of localized issues and enhance overall portfolio resilience.
Portfolio Construction Considerations
Currency management: for Canadian investors to manage any undesirable impact of fluctuations between US dollar denominated emerging markets credit and the Canadian dollar (CAD), the portfolio is typically hedged back to CAD, providing more predictable returns. This can be achieved in a cost-effective manner by the investment manager of the strategy using currency forwards, or other currency instruments.
Liquidity: emerging markets credit is generally a liquid asset class. For example, the liquidity of emerging markets corporate credit bonds is broadly comparable to that of developed market corporate bonds in normal market conditions.
Active management: there are numerous idiosyncratic economic and policy cycles across the different countries, which can contribute to added value opportunities for active managers. Also, like for emerging market equity, there are fewer sell-side research specialist for emerging markets credit compared to developed market credit, which creates opportunities for independent research. Skilled active managers can navigate market nuances, identify attractive opportunities, and adjust exposures in response to changing conditions.
Responsible investing: despite the political and social challenges associated with emerging market countries, governments and companies are increasingly recognizing the importance of environmental, social and governance (ESG) considerations.
Seize the Opportunity
Emerging markets credit presents a compelling investment opportunity with potential for higher yields, diversification benefits, and exposure to high-growth economies. Emerging markets credit can be a valuable addition to a well-rounded investment portfolio.


 Source: NS Partners & Bloomberg


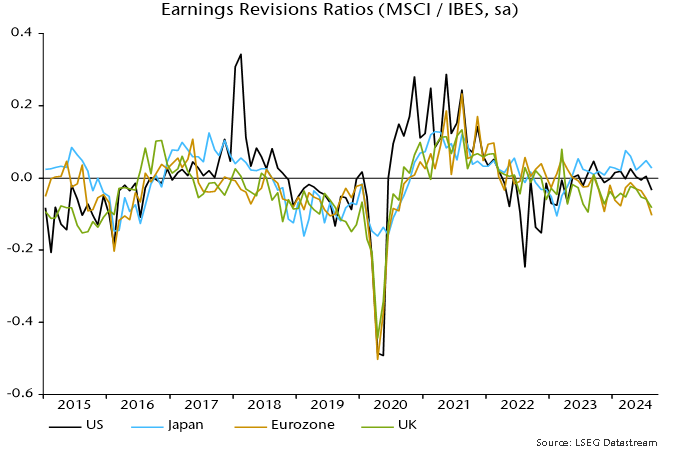
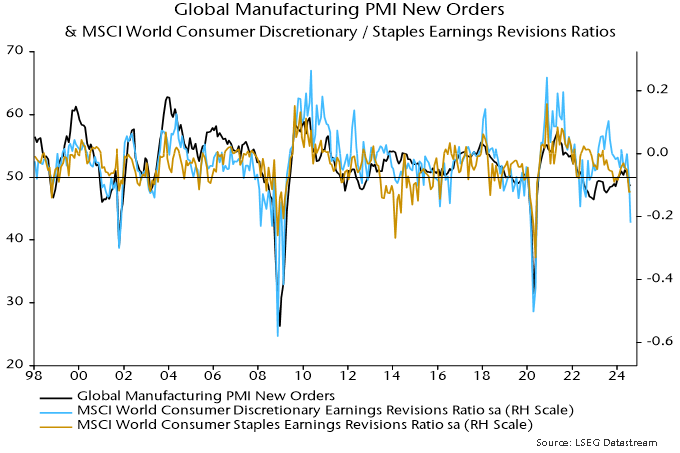
 Source: I/B/E/S
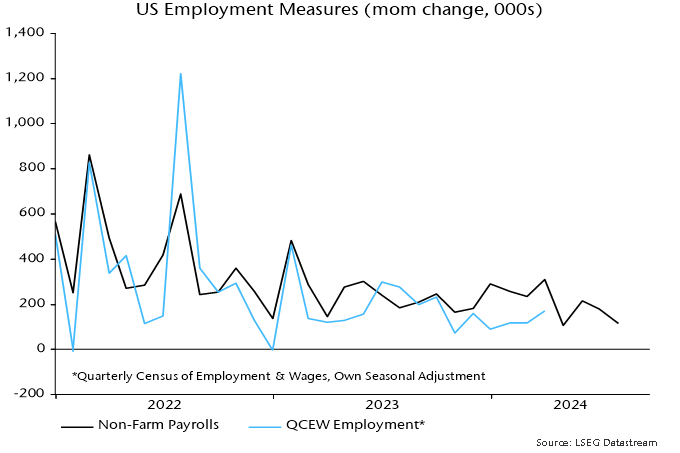
 Source: S&P Global, Macrobond
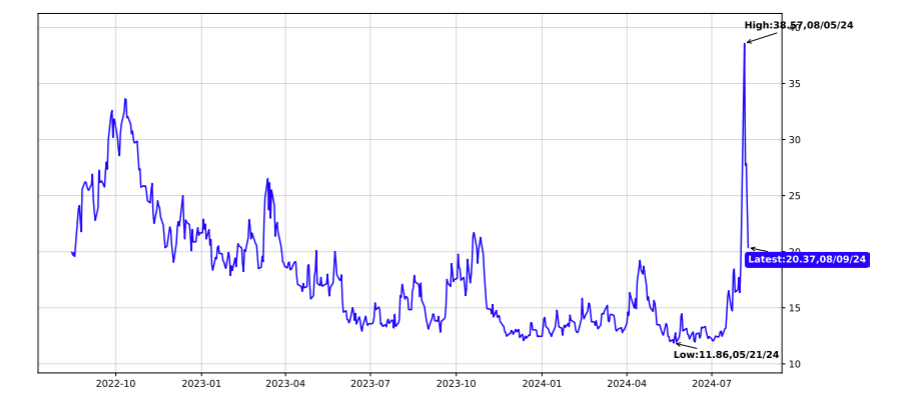
 Source: Chicago Board Options Exchange (CBOE), Macrobond
 Source: Federal Reserve, Macrobond
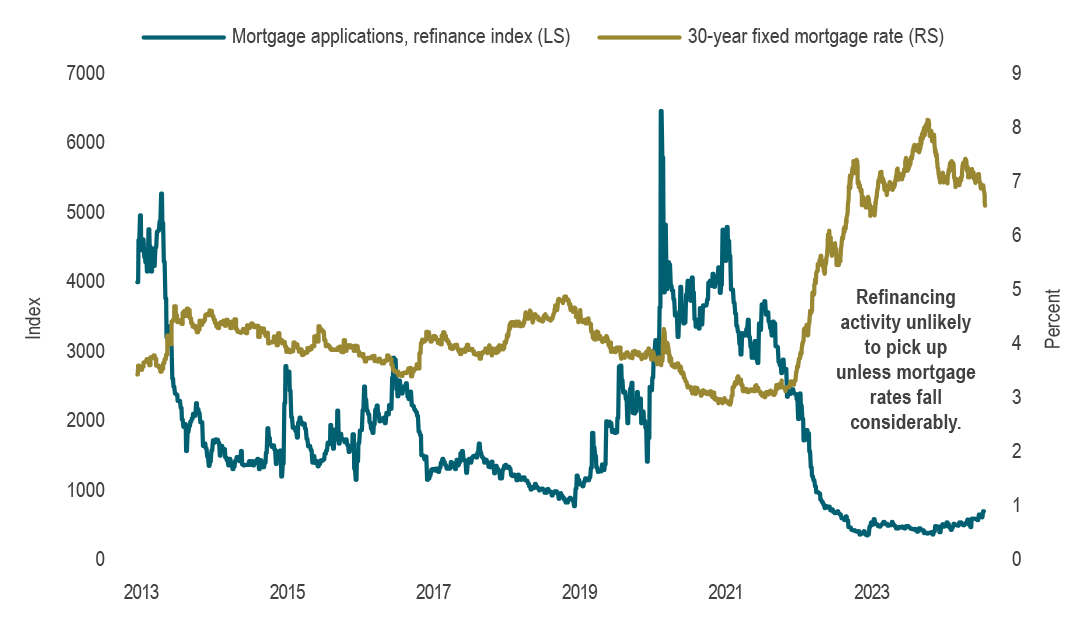 Source: MBA, Bankrate, Macrobond
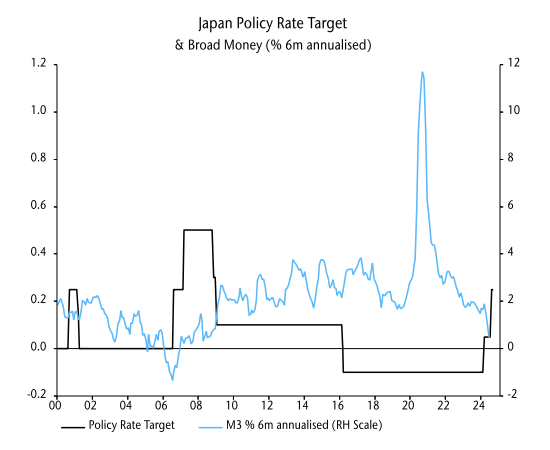
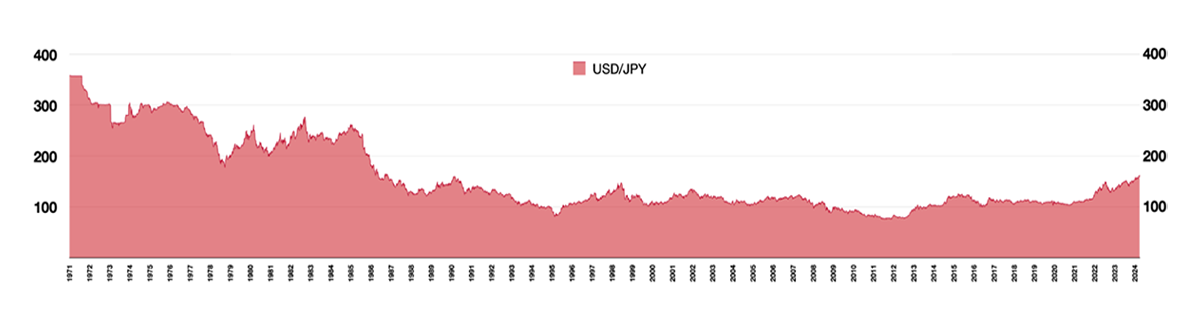 Source: Bank of Japan
 Source: public
 Source: public