Geothermal power plant in Iceland. Blue Lagoon.

Following the recent events in Israel, we would like to commend the management of Ormat Technologies for maintaining open lines of communication during this extremely stressful period. Ormat, a portfolio company based in Tel Aviv, entirely produces electricity from alternative sources located outside of Israel, which remain operationally unaffected by the turmoil. Although the company has a geothermal equipment production facility in Israel, it exclusively supplies international clients and equipment sales represent less than 12% of the company’s revenues.  

Economic factors and market dynamics 

Major geopolitical events like we are witnessing in Israel certainly do not help the case for $40 oil. Add  in high levels of government spending, increased regulations and large wage increases and  inflation remains well-supported. As we await a downturn to counterbalance, we can expect volatility in commodities prices, especially with oil, as the Middle East conflict continues.  

As the developed world spends its way toward decarbonization, analysts are attempting to predict peak oil production. The International Energy Agency (IEA) believes we are nearing that point while OPEC expects global demand to reach 116 million barrels per day (bpd) by 2045, up from 99.6 million bpd in 2022. OPEC has also made clear the potential for a higher jump. Growth is likely to be fueled by India, China, other Asian countries, Africa and the Middle East 

North American oil consumption and supply-side economics

Local oil consumption in North America continues to be moderate, as the adoption of electric vehicles and other alternative fuels gain momentum. However, supply-side economics seem to support a buoyant environment for oil service companies. Shale wells in North America offer very poor long-term output performance, with decline rates for oil wells exceeding 35% and losing an additional 0.5% each year. To maintain supply levels, oil companies must continuously explore, plan and drill new wells. As a result, regions such as the Permian Basin in West Texas are likely to remain active hubs for drilling and completion activities, especially if oil prices make exports profitable. In addition, many oil service companies are diversifying into new sustainable segments within the broader energy market, areas such as hydrogen, renewable gases, recycled water, etc. This has led the industry to re-position itself as an energy services provider rather than focusing solely on oil and gas.  

Innovations in energy service companies 

Global Alpha is invested in NOW Inc. (DNOW:US), a company that is using its extensive energy-industrial distribution network to launch its own carbon capture equipment. As well, its new Ecovapor technology reduces flaring while producing much cleaner gas.

Energy service companies are preparing for future market trends that are likely to garner investor attention. One notable event this year was the annual geothermal industry gathering in Reno, which attracted over 1,500 attendees. What set this year apart was the significant presence of oil & gas service industry professionals.  

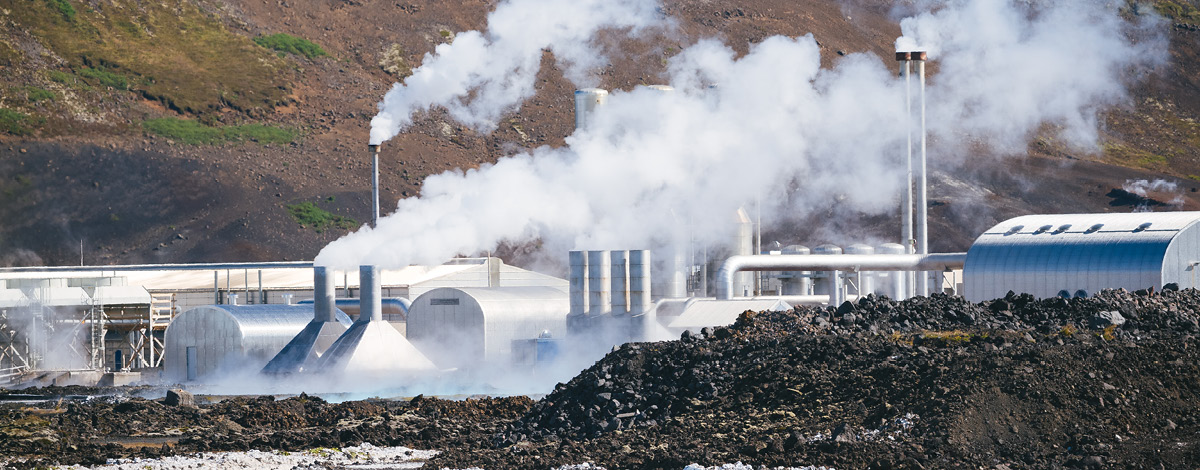
Geothermal energy: the next frontier 

The concept of “Geothermal Anywhere” or “Geothermal 2.0” is gaining traction. This involves leveraging inexpensive deep, high-temperature wells to operate geothermal plants beyond the Pacific Ocean’s “Ring of Fire” high-temperature zones.  

Estimates suggest that as much as 8% of the US’s entire energy production could come from geothermal sources, provided that feasibility and costs are optimized. Achieving this goal requires overcoming certain technical challenges, such as drilling into 250-degree rock three kilometres underground without causing significant equipment damage. Given the incredible advances in shale drilling technology over the last decade, chances are these issues will be solved.  

The addressable market is sizeable. Currently standing at $7 billion, geothermal capacity is 31 GW within a total 1,293 GW of US energy capacity. According to a 2019 publication by the US Department of Energy, the number of potential geothermal sites could exceed 5,000 GW. If the goal is to increase the share of geothermal energy from 2.3% to 8%, the market opportunity could surpass $25 billion in the US 

Investing in energy service companies 

We have exposure to the oil service industry through our investments in Austria-based Schoeller-Bleckmann (SBO:AV), which specializes in advanced drilling solutions. We also own Helmrich and Payne (HP:US), a leading energy service company in North America. HP has already invested in six  geothermal startups that tackle complex technical issues related to deep geothermal energy.  

It’s important to note that, in the short term, oil and gas service companies remain sensitive to the cyclical nature of drilling activities. The Baker Hughes rig count index, currently at a low of around 600 rigs, suggests that we might be approaching a trough, as these levels are near historical lows. Together with growing decarbonization markets, the new energy service industry is certainly an interesting place to be. 

The future of geothermal and our investment outlook

As markets focusing on reducing carbon emissions continue to expand, the evolving energy services industry is worth watching. If venture capital continues to flow into the Geothermal 2.0 concept and becomes a reality, our long-term holding in Ormat, already the industry leader in geothermal energy production, stands to gain. At present, the company has a robust pipeline of geothermal projects that use its patented shallow-drilling, low-heat technology, known as binary exchange. Even without Geothermal 2.0 as a new market segment, geothermal energy is already experiencing rapid growth, thanks in part to its ability to provide stable, non-peak electricity, complementing the variable output of solar and wind energy. 

As we adapt to a transitioning energy landscape, the confluence of traditional drilling expertise and emerging sustainable technologies may not just redefine the energy sector, but also reshape how we think about long-term investment opportunities. 

Estaiada's bridge night aerial view of São Paulo, Brazil's financial center.

Last week, our Emerging Markets (EM) team attended a fruitful Latin American (LatAm) conference in New York, hosted by BTG Pactual, the region’s leading investment bank. The event showcased a variety of promising investment ideas and featured rich discussions and robust participation. Hundreds of investors from around the world convened to meet with the c-suite executives and founders of about 200 companies, mainly from Mexico and Brazil.

Keynote speaker Stephen Schwarzman of Blackstone shared his view on the global geopolitical landscape and the current state of the US economy. He underscored the importance of constantly reinventing business models and taking risks in pioneering new products and services as a foundation for business durability.

Throughout the three-day conference, we conducted insightful meetings with 22 companies operating in the consumer, industrial, healthcare, financial, technology, energy, materials and real estate sectors providing a wide view of the LatAm economic landscape. In most of the conversations, we sensed cautious optimism, mainly driven by monetary easing and nearshoring trends. While most developed countries are grappling with inflation, many LatAm nations are in a disinflationary environment. Central banks in Chile, Brazil and Peru have already started cutting rates, with Colombia and Mexico expected to follow suit this year.

Nearshoring is a topic we’ve explored in previous writings, and it was a dominant theme among Mexican companies at the conference. Many see nearshoring-driven demand as structural and sustainable, providing ample growth opportunities across multiple sectors as global supply chains move to Mexico.

However, challenges do exist, such as infrastructural inadequacies, both industrial and residential (e.g., power and water availability, housing supply for labour), erratic political and regulatory climates, bureaucratic complexities and looming uncertainties around the upcoming elections in Mexico and the US. A possible spillover effect of “higher for longer rates” in the US also looms as a source of concern, potentially putting pressure on LatAm currencies amid the decoupling of monetary policies and eventual slowdown of the easing cycle in the region. Another area of concern is the ongoing tax reform in Brazil, well-known for its highly complicated tax system requiring nothing less than a PhD in law to properly understand all of its intricacies.

As for the top picks, we identified several promising opportunities that you might read about in our future commentaries, including:

  • Brazil’s largest operator of private oncology clinics and hospitals. The company leverages its strong brand and reputation, running a proven and scalable business model in a massive and dynamically growing market.
  • A fast-growing Brazilian athleisure brand enjoying strong brand awareness, a nimble operating model with great economics and ample white space for expansion.
  • The leading B2B online solutions provider to micro and small businesses, with a promising new product pipeline, well positioned for the digital transformation in Brazil with still low ecommerce penetration.

We also met with some of our LatAm holdings at the conference, including Odontoprev (ODPV3 BZ), which we initiated after our meeting with its management team at last year’s conference. Founded in 1987 by a group of dentists, Odontoprev is Brazil’s largest dental benefits provider, with over 8.4 million members and a cross-country network of 26,000 dentists. The company offers customized products to corporate customers and off-the-shelf products to SMEs and individuals, while leveraging its exclusive distribution network in a partnership with strategic shareholder, Bradesco. Its industry focus, well-established footprint, brand portfolio and proprietary dental tech infrastructure make it a standout among its peers. The company is run by a strong management team with a sound track record and rich industry expertise. Odontoprev has an asset-light business model and a low capex requirement with negative working capital generating high cashflow, resulting in a strong balance sheet in a net cash position. The company is a proven compounder with a 16% and 22% compound annual growth rate of revenue and net income, respectively, since its IPO in 2006.

The dynamics of EM, particularly in LatAm, are as layered as they are compelling. The investment choices we make today, be they cautious or bold, will have lasting implications.

Scheer, Rowlett & Associates Investment Management Limited (“SRA”) is pleased to provide a personnel update.

Lloyd Rowlett will be retiring from his role as Chairman of Scheer Rowlett as of December 31st, 2023 as part of the long term succession plan that began over 7 years ago, and Ratul Kapur will continue in his capacity as President and Chief Investment Officer at SRA (commenced on January 1st 2023).

“We founded the firm 27 years ago to manage money for clients using a value investment philosophy, and as I look back it’s fulfilling to see that we’ve stayed consistent with that approach over the entire time and through a wide variety of market conditions. We’ve done our best to ensure that clients who placed their trust in us were rewarded with the full efforts of our talented and committed team. I’m very proud of the quality of the individuals we’ve attracted to the firm whose duty will be to continue to do the best they can using the same value investment process for our valued clients after my retirement. I’m pleased with the returns we’ve posted over the past few years as Ratul has taken on more of my duties. I’m also confident that under his leadership the SRA team is very well positioned to continue to deliver strong performance to our clients through the same value investing approach the firm has utilized since it was founded.” says Lloyd Rowlett.

Lloyd’s retirement is the culmination of a carefully planned succession process that involved the gradual transition of his responsibilities to Ratul Kapur, who joined the firm in 2017, became Co-Lead PM in 2020, Co-CIO in 2021 and President and CIO on January 1st, 2023.

“On behalf of the entire SRA team, we would like to thank Lloyd for his mentorship and guidance over the years and congratulate him on a successful career as an investor and in setting up our business for long term success. As value investors, we remain excited about the prospects for our clients’ portfolios going forward and will strive to live up to the example that Lloyd has set for us in terms of discipline, commitment, and hard work. We wish Lloyd a happy and healthy retirement.” Ratul Kapur.

Sain Godil, a previous recipient of a scholarship, and Global Alpha have established $30,000 bursaries to support women studying finance at Concordia’s John Molson School of Business, with the goal of increasing diversity in the finance profession and helping to break down gender barriers.

Whether you realize it or not, behavioural biases and influences can lead to ineffective committee meetings and outcomes. However, having an awareness of their impact can not only contribute to making better decisions, but also improve portfolio returns. A combination of good investments and good behaviour is the recipe to achieving optimal outcomes.

Behavioural pitfalls can take many forms, such as the implications of not fully appreciating the likelihood of an occurrence or having a tendency to emotionally anchor consideration of alternative options to the current state of play. This article discusses these and other common pitfalls.

Pitfalls

One common pitfall is our tendency to underestimate the likelihood of an occurrence. Our assessment is often too focused on possible outcomes, whereas focus should be on the most likely or probable outcome. Another pitfall is not taking advantage of learnings from our experiences when reviewing different options. Taking advantage of our experiences increases the odds of making better-informed future decisions.

Anchoring is a tool used by car salespeople, where sticker prices on cars in a lot are much higher than what the buyer ends up paying. The sticker price anchors negotiations for the salesperson, but makes the buyer feel like they got a good deal when paying less than sticker price. Anchoring is one bias that plagues most investment committees when undertaking an asset mix review. Potential changes are compared to the current mix, which can make it emotionally difficult to stray too far from this mix. Moreover, such an emotional attachment may not be in the best interest of meeting the strategic goals.

Decision fatigue is a pitfall that most of us experience, but may not realize. It comes about when the number of decisions made in a day leads to our resolve being depleted and we put off decisions, or worse make bad ones. One cause of the fatigue is low glucose levels, which affects our decision-making energy.

Four villains

Chip and Dan Heath refer to narrow framing, confirmation bias, short-term emotion and overconfidence as the “Four Villains” in their book “Decisive”1. You have a decision to make, but narrow framing makes you miss options. Think of narrow framing as a spotlight shining on one area of a stage where everything else that could be important is in the dark and is therefore not being considered.

When analyzing different options confirmation bias leads you to gather self-serving information. When too much focus is on information that confirms your personal viewpoint, and less weight on information that goes against your view, it can lead to an under-appreciation of the risks associated with a decision. When you make a choice, short-term emotion can lead you to make the wrong one. Short-term emotion is most problematic for difficult decisions, where our feelings can adversely affect the decision with our heart ruling our head.

In making your decision, you can be overconfident of the future outcome. Overconfidence is an unfortunate state of mind where you believe you know more than you do about how the future will unfold, which understates the uncertainty associated with decisions.

Managing behavioural biases

Behavioural pitfalls cannot always be avoided, but they can be managed.

Figure 1: Managing the pitfalls

Behavioural pitfalls How best to manage
Assessing the odds Focus on the probable
Memory recall Be prepared
Anchoring Be open to ways to limit
Decision fatigue Early is best; review strategic items first, have breaks and snacks


When assessing choices, it is important to understand the likelihood of an occurrence and focus your efforts and energy on the probable outcomes. When retrieving a memory your brain “replays” the nerve pathways created when the memory was formed. Recalling information helps strengthen our memories, highlighting the importance to be prepared for meetings in order to benefit from experiences and past learnings.

Being aware that some biases exist goes a long way to limiting their influence. When it comes to other biases such as anchoring, it is important to be open to ways to reduce influences. For example, when undertaking your next asset mix review, disguising the different mixes can help manage the risk of an emotional attachment to the current mix.

To combat decision fatigue, the best option is to schedule meetings early to improve the odds of making effective decisions. If meetings late in the day cannot be avoided, then agenda items should be organized with the most important first, when energy levels are higher. Having snacks available to provide a recharge of energy levels will also improve decision-making.

Managing the four villains

The “WRAP” process can help tackle each of the four villains.

Figure 2: managing the villains

Four villains WRAP process
Narrow framing Widen your options
Confirmation bias Reality-test your assumptions
Short-term emotion Attain distance
Overconfidence Prepare to be wrong


Widening options can uncover ideas that you may not have thought of and helps to avoid narrow framing. The concept is to think of physically moving the spotlight away from the area previously focused on in order to uncover different ideas or options. For example, if your committee is struggling with a particular challenge, reach out to a peer in the industry to find out how they tackled a similar challenge as a way to widen your perspective.

One approach to take when faced with confirmation bias is to reality-test assumptions by having someone play a devil’s advocate role to create constructive challenges and discussion prior to finalizing the decision.

To manage short-term emotion consider putting some distance between reviewing options and making a decision. The “10/10/10” tool developed by business writer Suzy Welch provides an elegant way of requiring us to put some distance when assessing decisions. Imagining how we will feel 10 minutes, 10 months and 10 years from now can help alleviate the emotional impact, since the longer the timeframe, the less the impact from emotional influences.

For overconfidence, you should prepare to be wrong, no matter how confident you may be. Having an appreciation that there is a risk things may not go exactly as planned can create an important awareness when assessing options.

Making better decisions

Sitting on an investment committee is a role where many decisions are required. While you cannot control how investments will perform, you can manage how behavioural influences and biases can negatively affect decisions. By doing so, you will improve the odds of meeting your long-term goals.

1 Heath, Chip., and Dan Heath. Decisive: How to Make Better Choices in Life and Work. New York: Crown Business, 2013.


Subscribe for updates

Yasaka Pagoda behind an alley in Higashiyama, Japan.

Japan has been quite cautious with pandemic control. Only on May 8, 2023 did the government downgrade COVID-19 to the same level as seasonal influenza. The country’s Q2 GDP grew 1.2% quarter-on quarter, outpacing market expectations, mainly driven by a rebound in exports and an increase in tourist arrivals. Japan boasts the world’s largest electronics industry and ranks third in automobile production. Real wages have turned positive for the first time in seven quarters and corporate appetite for investment was solid. 

In September, two of our team members participated in investment conferences and conducted company visits in Japan. Business operations in the country are back to normal. Inbound tourism is visibly booming. Making a reservation at a restaurant is a must. In August, about 2.2 million foreign visitors travelled to Japan, representing 85.6% of the visitors seen in the same month in 2019. For context, about 32 million foreign tourists visited Japan in 2019 and spent a record high of ¥4.8 trillion

Behind these short-term recovery signs, there are also indications of some long-term structural changes that lead us to believe that Japan is at inflection point and shifting from a deflationary to inflationary environment.  

Japan inflation rate 

These structural changes include: 

  1. Notable improvements in balance sheets. Historically, Japan’s prolonged deflation was triggered by the 1990s real estate bubble burst. This caused a credit crunch and a liquidity trap, essentially resulting in a balance sheet recession. Now, both property prices and corporate balance sheets have been on a consistent growth path.
  2. The Yield Curve Control (YCC), having faced challenges, is likely to be phased out in the coming months. Introduced in 2016 by the Bank of Japan (BOJ) to combat deflation, YCC’s objective was to maintain low yields to stimulate consumer and business spending. This approach worked well when inflation was low because investors could enjoy the safe returns of government debt. But with inflation eroding those gains since the spring of 2022, investors have started to sell government bonds, pricing in the chance of a near-term rate hike. To maintain this framework, the BOJ intervened by buying bonds, to little avail. In December 2022, the BOJ doubled the band to allow the 10-year yield to move 0.5% above or below zero. Nevertheless, the 10-year Japanese Government Bond yield recently rose to 0.805%, a decade high. Many economists now expect the BOJ to discontinue the YCC within the next six months. We agree with this view and think the next logical step is for the BOJ to raise its short-term policy interest rate from -0.10% to 0%, given that inflation, largely attributed to wage growth, seems persistent. 
  3. Wages are on the rise again, a trend that should continue, driven by a severe long-term labour shortage. Japan may face a shortage of more than 11 million workers by 2040. Wage negotiations, particularly between major corporations and Rengo, also known as the Japanese Trade Union Confederation, are under close watch. The average wage hike was 3.58% in April 2023, the highest in three decades. For April 2024, the estimate is another hike of around 3%. 

Japan’s stock market has recently reached a peak not seen in 30 years, with the Nikkei 225 Index up 19% year to date. Warren Buffett’s investment in five Japan-based trading companies provided a vote of confidence, indicating Berkshire might own as much as 9.9% of each of these companies. Many investors are attracted by cheap valuations, the return of inflation and a depreciated yen. 

Early this year, the Tokyo Stock Exchange urged companies to boost their price-to-book (P/B) ratios. Half of the companies listed on the Tokyo Stock Exchange trade at a P/B ratio of below one, compared with just 3% of firms on the S&P 500 Index. As highlighted earlier, businesses now have solid balance sheets, positioning them to enhance shareholder returns. In the fiscal year 2023, the dividends and share buybacks of companies on the Nikkei 225 were at record levels. 

Historically, Japanese small caps have outperformed large caps over the long term. However, since 2018, persistent macro uncertainties have swayed investors towards the relative stability of large caps.  

Japanese small caps outperforming large caps (through Aug 2023) 

Source: Nomura based on Nikkei 

We believe Japanese small caps are poised to outperform, mainly due to three reasons.  

  1. Historically, small caps outperform during economy expansions thanks to their better growth potential.  
  2. Small caps are expected to have accelerated profit growth in the fiscal year 2024. As of October 6, 2023, the EPS of MSCI Japan Small Caps is expected to rise by 11.6% compared to the 6.5% growth expected for its large peers. 
  3. Small-cap valuations are nearing historic lows compared to large caps, the biggest discount in 11 years. 

Source: Nomura, based on Toyo Keizai. 

You may be curious about the impact of rising interest rates on our portfolio. Reassuringly, half of our Japan-based holdings are in a net cash position and the remainder carry low debt. A strong balance sheet has consistently been a key factor in our stock selection process. What’s more, to benefit from rising interest rates, this year we initiated a position in Concordia Financial Group (7189 JP), Japan’s third-largest regional bank, because we believe its growth will accelerate in a rising interest rate environment 

Amid Japan’s profound economic changes, we remain vigilant and adaptive, constantly refining our strategies and insights to help ensure that we navigate this evolving landscape in the best interests of our investors. 

US September non-farm payrolls blew through the consensus expectation but the totality of evidence from the employment report suggests that the labour market continues to cool.

Including upward revisions to the prior two months, 455,000 jobs were added to the payrolls tally in September. However, this follows three weak months when the revisions-adjusted gain averaged 105,000 – see chart 1.

Chart 1

Chart 1 showing US Non-Farm Payrolls Change (000s) First Estimate Actual & Adjusted for Revisions to Prior 2 Months

The alternative household survey employment measure – which counts people rather than jobs – grew at half the pace of payrolls in the three months to September – chart 2.

Chart 2

Chart 2 showing US Employment Measures (% 3m annualised)

The relative strength of payrolls partly reflects a further rise in multiple job-holding, which is approaching its pre-pandemic peak, i.e. the relative boost may be ending – chart 3.

Chart 3

Chart 3 showing US Multiple Job Holders (mn)

Stepping back, stronger growth of payrolls than GDP since end-2021 represents a catch-up following a big undershoot of trend during the pandemic – chart 4.

Chart 4

Chart 4 showing Ratio of US Non-Farm Payrolls to GDP* *Number of Employees per $ mn at Constant Prices

The catch-up appears complete, suggesting that payrolls will resume slower growth than GDP. The slope of the trend line implies a fall in payrolls if GDP growth declines below 1% annualised.

Temporary help jobs have led at prior peaks and troughs in payrolls and continued to decline in September – chart 5.

Chart 5

Chart 5 showing US Non-Farm Payrolls (mn) & Temporary Help Services Employees (000s)

The unemployment rate, meanwhile, held at its higher August level, with the demographic breakdown showing a sharp jump among prime-age males – chart 6.

Chart 6

Chart 6 showing US Unemployment Rates

Verdict: neutral / negative – headline surprise offset by weaker internals.

Asian worker working in the steel market.

Following my trip to China in May 2023 and my recent commentary from June, I believe it is important to continue to share our thoughts on China, especially in light of recent disappointing economic developments and the new policy measures aimed at addressing its slowing economy.

Have we reached peak pessimism about China?

The real estate sector, along with its related industries, accounts for 20% to 30% of China’s GDP and has failed to rebound as expected. From January to July, real estate investment fell 8.5% year-on-year. Residential building areas deceased by 7.1% and total new construction areas declined by a quarter according to the National Bureau of Statistics.

China’s government has announced a slew of measures in the past few months to stimulate the sector, including:

  • Fiscal incentives: The Ministry of Finance on Aug. 18 extended personal income tax rebates for households upgrading their apartment until the end of 2025.
  • Mortgage easing: Banks no longer exclude those who have a repaid a mortgage from qualifying as first-time buyers if they don’t currently own a property. Big cities including Guangzhou and Shenzhen adopted this policy on Aug. 30.
  • Home-loan cuts: Starting Sept. 25, first-time homebuyers can renegotiate their mortgage interest rates, as announced by the central bank on Aug. 31.
  • Downpayment reductions: On Aug. 31, Beijing lowered the minimum downpayment ratio across the country to 20% for first-time homebuyers and 30% for second purchases.
  • Urban renewal: The State Council announced redevelopment support for older villages within mega cities. Metropolises including Shanghai and Guangzhou are following up.
  • Other measures: These include a nationwide cap on real estate commissions, allowing private equity funds to raise capital for residential property developments, pledging ¥200 billion (CDN$28 billion) in special loans to complete stalled housing projects and extending some of the 16-point plan to address liquidity issues in the sector.

We should soon find out if these measures prove adequate. The Mid-Autumn Festival from Sept. 29-30 followed by a week-long holiday from Oct. 1-6 for National Day is traditionally the busiest period of the year for real estate sales. But what if the bubble continues to deflate? Could it lead to a collapse contained within China or a long stagnation like Japan experienced? Or to something more globally damaging similar to the Great Financial Crisis of 2008?

Will China crash?

Contrary to these fears, we do not see a huge financial crisis in China. The country is a major creditor, most of its debts are in its own currency and the government controls all of the key banks.

The current risk is the elevated savings rate, which could weaken demand.

Is China’s economic situation a repeat of Japan in the early 90s?

China today and Japan 30 years ago share many similarities: high debt levels, an aging population and a property bubble pop after years of growth. But China’s asset bubbles are comparatively smaller. And, in some cases, one could argue that the US also is in bubble territory. The following table is quite telling:

  China US Japan
(1990 peak)
Property value/GDP 260% 180% 560%
Stock market/GDP 65% 151% 142%
Urbanization rate 65% 83% 77%
Debt/GDP 95% 122% 62%

Source: World Bank and IMF.

Is it all bad? Can China bounce back?

China’s economy was supposed to drive a third of global economic growth this year. Its recent slowdown is sounding alarm bells across the world. According to an International Monetary Fund analysis, when China’s growth rate rises by 1 percentage point, global expansion is boosted by about 0.3 percentage points. Asian economies, along with African countries have been most affected by diminished trade. For example, Japan reported its first drop in exports in more than two years in July after China cut back on purchases of cars and semiconductors. Central bankers from South Korea and Thailand last week cited China’s weak recovery as a reason for downgrading their growth forecasts. The value of Chinese imports has fallen for nine of the last 10 months as demand retreats from the record highs set during the pandemic. The value of shipments from Africa, Asia and North America were all lower in July than a year ago. But is the situation as dire as appears? Some indicators seem to tell a different story.

The price of oil is approaching $100. According to a September report by OPEC, global crude oil demand is expected to reach a record 102.06 million barrels per day in 2023, up 2% from 2022. Demand in China, the world’s second-largest crude oil consumer, is projected to grow by 6% to 15.82 million barrels, an upward revision of 50,000 barrels from August. Official customs data shows that China’s crude oil imports in August reached 52.8 million tons, up 21% from the previous month. This translates to a 31% year-on-year increase and a 25% rise over pre-pandemic levels in August 2019. With overseas travel from China still not back to pre-pandemic levels, further growth in demand for crude oil and petroleum products could be expected as noted by Dominic Schnider, UBS’s head of commodities and Asia-Pacific currency markets.

In terms of metals, China’s refined copper consumption was the second-strongest year to date in August, a month when demand would typically weaken due to hot weather. This was reflected in a 36.6% increase month over month in China’s copper concentrate imports in August.

China’s aluminium imports jumped 38.9% in August from a year earlier, customs data shows.  Imports of bauxite, a key raw material for aluminium, totaled 11.63 million tons last month, up 9% from the year prior. Bauxite imports in the first eight months of the year, at 96.62 million metric tons, were up 11.8% from a year earlier.

In our last commentary on China, we highlighted how it is trying to transition its economy away from real estate, infrastructure and exports to a more sustainable model led by domestic consumption, services and tourism. There is a lot of potential to unleash tremendous growth if Chinese consumers decide to increase their spending.

A study by the Australian Strategic Institute earlier this year showed that China leads in 37 of 44 tech fields, ranging from AI to robotics. China graduates 1.4 million engineers each year and leads the world in patent applications.

Source: World Economic Forum.

Technology fields and leading countries

Source: Australian Strategic Institute.

So, while there is a case for optimism, what if relations between China and its trading partners continue to deteriorate. What if trade barriers go up?

Who could replace China as a global economic engine?

Policymakers in the West may view a China slump as a geopolitical respite, but it raises a significant question: what are the global repercussions if China’s economy were to permanently stagnate?

According to World Bank data, China GDP grew by 263% between 2008 and 2021, while global growth was only 30%. China accounted for more than 40% of global growth during that period. Although some experts have pointed to India as a possible successor, it’s not a given. India’s manufacturing sector has contracted in recent years and private investment accounts for a smaller share of GDP than it did a decade ago.

Could this signal the end of global economic growth?

Global growth by period

1962-1973 5.4%
1977-1988 3.3%
1991-2000 3.0%
2009-2023 65%

Source: Capital Economics

We do not think the China growth story is over and believe the China pessimism is too extreme.

Global monetary trends appear inconsistent with economic expansion and recent levels of financial asset prices. Central banks are likely to be forced to reconsider policy stances, by market / financial instability and / or unexpected economic weakness.

Key developments during Q3 included:

  • Global composite PMI new orders – a timely indicator of economic momentum – extended a decline from a local peak in May.
  • Global six-month real narrow money momentum fell to a new low, suggesting a further PMI slide into early 2024 – see chart 1.
  • Inflation news was favourable, with US and Eurozone core momentum slowing significantly.
  • Major central banks ignored these developments, tightening policies further and signalling “higher for longer”.
  • Hopes that Chinese easing would act as a counterweight to G7 restriction were dashed by the PBoC allowing money rates to firm significantly into quarter-end, perhaps reflecting concern about capital outflows.
  • Global “excess” money momentum, as measured by the differential between six-month rates of change of real narrow money and industrial output, became more negative – chart 2.
  • The stock of excess money, i.e. the ratio of real narrow money to industrial output, fell to its lowest level since February 2020 before the covid policy response and associated monetary surge.
  • US real Treasury yields extended a third major move higher since late 2021, interpreted here as reflecting the intensified excess money squeeze coupled with higher for longer guidance.
  • Global equities gave back most of their Q2 gain as higher real yields dragged valuations lower.
  • The yield surge contributed to underperformance of growth and non-US quality while restraining outperformance of defensive sectors.

Chart 1

Chart 1 showing Global Composite PMI New Orders & G7+ E7 Real Narrow Money (% 6m)

Chart 2

Chart 2 showing G7 + E7 Industrial Output & Real Narrow Money (% 6m)

Current and prospective monetary trends appear too weak to support recent levels of economic activity and market wealth. Two scenarios for relieving the monetary shortage may be considered.

In the better scenario, a further fall in inflation coupled with modest weakness in activity results in global excess money contraction moderating into end-2023, with an associated reversal lower in real yields. (Equity market performance is related to the sign of the level of excess money momentum while yield movements are related to the sign of the rate of change.)

Inflation progress and softer labour market data prompt central banks to retract higher for longer guidance and cut rates in early 2024, extending the move lower in yields. Falling yields support growth and quality, limiting weakness in equity indices.

Lower rates revive nominal money momentum in H1 2024, laying the foundation for an economic recovery during H2. Inflation continues to fall as core / wage pressures fade, moving to an undershoot in late 2024 / 2025 in lagged reflection of monetary weakness in 2022 / 2023.

Equity markets recover during H1 2024 as excess money momentum turns positive. Near-term outperformance of defensive sectors reverses as improving economic prospects for late 2024 / 2025 lift cyclical areas.

The suggestion in this scenario of modest / short-lived economic contraction is consistent with the cyclical analysis framework employed here: major downturns in the housing and business investment cycles are not expected before 2025, while the stockbuilding cycle is scheduled to recover in 2024.

In the worse scenario, recent policy tightening and surging yields result in a further fall in nominal money momentum, offsetting the impact of lower inflation and declining activity on real / excess trends.

Real yields are stickier and equity markets fall further, with defensive sectors outperforming significantly.

Intensified economic weakness and an ongoing monetary shortage trigger one or more credit “events”, raising financial stability concerns. Central banks cut rates but are viewed as having lost control. Investors price in a tail risk of excessive easing and another inflation surge later in the decade.

Inflation falls faster and further than in the better scenario, contributing to a larger eventual decline in rates and Treasury yields. The beneficial effect on monetary trends, however, is delayed by “endogenous” tightening via wider credit spreads and wealth losses.

The suggestion in this scenario of significant multi-quarter G7 recessions could be reconciled with the cycles framework by arguing that the rate shock advanced the housing cycle peak expected around 2025, i.e. the downswing will play out over 4-5 years rather than a more normal 2-3.

The subjective probabilities assigned here to the two scenarios will be adjusted in response to incoming nominal money data.

The further fall in global six-month real narrow money momentum in Q3 was mainly attributable to declines in China and India, confirming a need for PBoC easing and questioning consensus optimism about Indian economic prospects. Momentum remains weaker in Europe than the US – chart 3.

September manufacturing PMI results are broadly consistent with the real money momentum ranking – chart 4 (rank correlation coefficient = 0.76). Minor anomalies include India, Brazil and Switzerland (downside risk to current PMI ranking suggested by money trends), and Japan and Sweden (upside).

Chart 3

Chart 3 showing Real Narrow Money (% 6m)

Chart 4

Chart 4 showing Manufacturing Purchasing Managers’ Indices
China digital display of stock market charts.

Summary

  • EM equities were down through the month, with Chinese equities continuing to drag.
  • Foreign investors dumped over US$3 billion of Chinese stocks through the month, despite better-than-expected retail sales figures (up 4.6% year on year) and industrial production numbers (up 4.5% year on year) for August.
  • Manufacturing PMIs also ticked up to 49.7 from 49.3 (above 50 points signals expansion).
  • New issues from Chinese banks also surged, beating expectations.
  • Industrials, staples and communications names in India outperformed wider EM, as did AI-linked semiconductor names in Taiwan and Korea.

Don’t look down

Is this the Wile E. Coyote over the canyon moment for markets? The delayed impact of vertiginous rate hikes across DMs on all maturing debt is now hitting consumption and investment. Yet central banks continue to talk tough and market pundits fret over the implications of “higher for longer rates.” It certainly feels like we are in a critical juncture for markets and the economy. Resilience of assets outside of fixed income appear out of step with the reality of higher rates and a weakening global economy, as illustrated by global PMIs falling for a fourth consecutive month.

Global Manufacturing PMI New Orders & G7 + E7 Real Narrow Money (% 6m). Source: Refinitiv Datastream.

Poor money numbers globally suggest that further economic contraction is likely. Despite this, central banks continue to talk tough on rates and many investors cling to hopes of a no landing/immaculate disinflation scenario unfolding, despite the cracks emerging in the global economy. 

Echoes of the GFC

Some market commentators are comparing the complacency in markets to the 2006-7 period where investors bought into the idea of a soft landing, just as the lagged effect of excessive interest rate hikes began to roll through the economy.

JP Morgan’s Marko Kolanovic was quoted in the UK’s Financial Times noting the magnitude of change in interest rates in this cycle is around 5x the increase over 2002-2008 (FT Alphaville: Is it good when Wall Street compares today to 2007?). Kolanovic also pulled archive strategy commentary from 2007 which speaks to some of the risks markets face today:

“The economy provides compelling evidence that it is more resilient than many had earlier believed. … [R]enewed momentum is confirmed as economic data over the balance of December 2006 and January 2007 show an economy shaking off the effects of higher interest rates and high commodity prices. Market participants give up the ghost on their hopes for easings, accept that the Fed has engineered a soft landing, and buy (literally) into the view that a Goldilocks economy is in the making. Economic growth is solid at around 3% and led by a reinvigorated consumer; the residential housing sector slowly stabilises; corporate earnings growth moderates but doesn’t collapse; and inflationary pressures ease off but do not dissipate. Risky assets trade at full valuations and remain in a narrow, low vol range. We’ll call this the “head fake” phase — everything feels too good to be true because it is. In case you didn’t notice, this is where we are right now.”

As the article notes, history tends to rhyme rather than repeat and the availability heuristic of taking short cuts through sketchy historical analogies to explain the situation today can lead investors astray.

Indeed, the 1970s were a far from perfect comparison to post-pandemic inflation – we were flagging last year that a crash in broad money numbers would see inflation rattle back and even undershoot in 2024 (see chart below). This forecast remains on track despite the anxiety over rising energy prices. In contrast, broad money (our primary leading indicator for inflation) remained persistently high in the 70s.

G7 & E7 Consumer Prices (% YOY). Source: Refinitiv Datastream.

In the pre-GFC era, central banks were signalling their commitment to keeping inflation in check while acknowledging that stresses in the system were starting to materialise. Talking tough today about “higher for longer” rate settings looks to us like the equal and opposite error to the excessively loose policy coming out of COVID lockdowns.

We question the widely held assumption that the global economy can muddle through without any shift in monetary policy in the months ahead. Our best bet is that global economic growth is likely to surprise to the downside in the next 3-6 months.

Green shoots

However, there is a silver lining. Unlike in 2007, most of the debt resides with governments and central banks rather than corporates and households. Price insensitive authorities can “extend and pretend”, socialising losses and thus providing some cushion to the impact of rate hikes. It may suggest why rapid rate increases haven’t yet bitten as hard as we initially expected.

Another positive trend (particularly for EM) is a likely bottoming in the global stock building cycle.

G7 Stockbuilding Cycle. G7 Stockbuilding as % of GDP (YOY change). Source: Refinitiv Datastream.

Excessively high inventories in industries from semiconductors to apparel have been in a clean out phase amid weaker consumer demand, which in turn puts downward pressure on commodities prices.

G7 Stockbuilding as & of GDP (YOY change) & Industrial Commodity Prices (% YOY). Source: Refinitiv Datastream.

Emerging markets provide the bulk of these goods and commodities, and will therefore benefit from a bottoming out of this downcycle in the next few months.

In Taiwan and Korea, we have seen semiconductor names rallying on reports that the sharp post-COVID inventory destocking cycle is approaching its end, and boosted by demand for high performance chips that power AI. In apparel, Nike recently reported a US$9 billion decline in inventories (down -10% year on year). Nike has up until now been forced to rely on discounts and promotions to clear inventory amid a period of subdued demand and higher competition from rivals like Adidas. Nike will now start to restock with new lines to be sold at higher prices, boosting profitability. Competitors are likely to follow suit, which collectively will boost EM companies that dominate the apparel supply chain.

The long term picture is bright for EM

While the near-term risks brought about by a global slowdown underpin our cautious positioning, there are compelling reasons to expect EM to outperform DM on the other side of this slowdown. Low inflation and higher rates in EM will open the door to rate cuts, while valuations and earnings are supportive. China looks oversold and could rally on more meaningful stimulus. Growth elsewhere, in Southeast Asia and countries like India, look set to outstrip their developed counterparts. As inflation continues to fall and the tightening cycle ends, global money numbers can revert into positive territory. This will be the key ingredient for an emerging market resurgence, as excess liquidity will flow to the superior fundamentals on offer in EM.