TORONTO, ON, January 29, 2021 – Crestpoint Real Estate Investments Ltd. (“Crestpoint”) today announced the acquisition of two significant investments with a total value of $205 million: i) Legacy Apartment Portfolio, and ii) FedEx Distribution Centre. Following these major acquisitions, Crestpoint’s total assets under management have grown to $5.5 billion.
VANCOUVER, BC
Legacy Apartment Portfolio – various addresses
Legacy Apartment Portfolio is comprised of 15 multi-family residential properties, acquired from six different vendors, strategically located across Metro Vancouver. The portfolio includes nine concrete mid-rise apartments and six wood frame apartments. The properties range in size from 14 to 72 units with a mix of bachelor, one bedroom and two bedroom units, with a total of 614 residential suites across the portfolio. Located in the highly desirable and amenity-rich neighbourhoods of Vancouver’s West End, Kitsilano/West Point Grey, South Granville and Marpole, the portfolio has an average walk score of 90. Crestpoint, on behalf of the “Crestpoint Core Plus Real Estate Strategy”, its open-end Fund, partnered with InterRent REIT with each acquiring a 50% interest.
“We are thrilled to be acquiring such an irreplaceable core multi-family portfolio in one of the most sought-after residential markets in the world. As our first residential investment for our Fund, we are excited to use this as a launching pad into the multi-family sector and look forward to partnering with InterRent REIT, one of the most highly regarded operators in the sector” said Elliott Altberg, Executive Vice President at Crestpoint. “The multi-family residential sector in Canada is highly fragmented and has historically been characterized by stable, attractive risk adjusted returns. As such, we look forward to further expanding our multi-family presence across Canada and are eager to continue diversifying our Fund into this highly desirable asset class.”
WINNIPEG, MB
FedEx Distribution Centre – 365 Black Diamond Blvd.
Strategically situated on 38.1 acres of land in Southeast Winnipeg, the FedEx Distribution Centre is a 248,000 square foot brand new design-build package distribution and sorting facility. It is located in Boniface Industrial Park, Winnipeg’s second largest industrial park and offers convenient access to numerous key transportation routes. The state-of-the-art Class-A facility features a clear height of 28 feet with 76 dock loading doors and six drive-in doors. The single-tenant industrial property is fully leased to FedEx for 15 years. Crestpoint acquired the asset within the “Crestpoint Core Plus Real Estate Strategy”, Crestpoint’s open-end Fund.
“This asset represents Crestpoint’s second industrial acquisition in Winnipeg in the last 14 months, providing the Fund with geographic diversification and exposure to a high-quality core industrial asset. Given its central location within the Winnipeg market and the long term commitment from such a reputable tenant we are really excited to add this asset to our Fund.” said Kevin Leon, President & CEO of Crestpoint.
About Crestpoint Real Estate Investments Ltd.
Crestpoint Real Estate Investments Ltd. is a commercial real estate investment manager, with $5.5 billion of gross assets under management, dedicated to providing investors with direct access to a diversified portfolio of commercial real estate assets. Crestpoint is part of the Connor, Clark & Lunn Financial Group, a multi-boutique asset management company that provides investment management products and services to institutional and high net-worth clients. With offices across Canada and in Chicago, New York and London, Connor, Clark & Lunn Financial Group and its affiliates are collectively responsible for the management of over $86 billion in assets. For more information, please visit: www.crestpoint.ca
Contact
Kevin Leon President Crestpoint Real Estate Investments Ltd. (416) 304-6632 [email protected]
It has been a year since COVID-19 emerged, and the world is still struggling to contain the virus. In the past year, the nations and regions that had better control over the virus have seen faster economic recovery. China, for example, announced that their 2020 Q4 GDP grew by 6.5% year-on-year, which has surpassed the GDP growth of 6% in Q4 2019. This brings China’s 2020 GDP growth to a total of 2.3%. By comparison, the United States (US), Eurozone, and Japan are forecasted to contract by 3.6%, 7.4%, and 5.3%, respectively.
For China, industrial production was the growth engine, increasing by 2.8% in 2020, as global demand for medical equipment, home improvement products, and home office electronics was strong. Despite overall consumption lagging production, online retail sales posted a solid 15% growth. Online channels accounted for one quarter of total retail sales, up from just 4% in 2019. Companies we hold in our portfolios also benefited from the strong online retail growth in China. L’Occitane, for example, is a maker of natural and organic ingredient-based cosmetics and well-being products. Their online sales in China grew by 83.5% in the six months ending September 2020, and accounted for approximately 32% of their total China sales. It was ranked the number 1 brand for body care and hand care on T-mall, the largest ecommerce platform in China. Similarly, online sales of Asics, a manufacturer of sports shoes and sports apparels, more than doubled in the nine months ending September 2020, and accounted for over 30% of its sales in China. Also, profits of the beverage manufacturer Vitasoy increased by 27%, as online and home channels delivered strong results.
The fast growth of ecommerce also boosted logistics demand. According to the State Post Bureau, China’s total express delivery volume rose by 37% in December 2020, following the 37% and 43% growth in November and October 2020, respectively. Kerry Logistics, a third-party logistics service provider we own in our portfolios, has benefited from the surging domestic and cross-border shipping volume. The number of cross-border ecommerce consignments they handled in the first half of 2020 increased by 24% compared to last year. In addition, the strong overseas demand has driven the cost of shipping from China to Europe and the US to triple or quadruple in recent weeks. As one of the few Asia-based global freight forwarders, Kerry Logistics has leveraged its unique market position to capture the growing demand. Its international freight forwarding segment profits increased by 40% in the first half of 2020. Another positive update on Kerry Logistics is the completion of the spin-off of its subsidiary, Kerry Express Thailand, in late December. The listing was well received by investors, with its shares rising as much as 161% from the IPO price in debut. In addition to ecommerce, the potential distribution of COVID-19 vaccines could also help drive the company’s revenue and profit growth. Kerry Logistics has nearly one million square feet of cold chain facilities in Hong Kong, and is well equipped to handle drugs, including vaccines, antibiotics and insulin.
China has been leading the world on the digital payment front, with the highest mobile payment penetration rate of 32.7%, versus 15% in the US. The Chinese government has taken a step further to start testing the use of its own digital currency, Digital Currency Electronic Payment (DCEP), which is a digital version of its official currency, Yuan. Pilot projects have been ongoing in Shenzhen, Xiong’an, Chengdu, and Suzhou since August 2020. The official rollout could be as early as 2022. DCEP’s share of China’s digital payment market is expected to reach 9% in 2025, and 15% in 2030. To be launched domestically first, the digital Yuan will help smooth monetary policy transmission and help policymakers regain control over money flow and consumer spending data from Alipay and WeChat Pay. Eventually, it could be used to promote the Yuan’s global status and become China’s preference for cross-border payments, bypassing the Swift network amid rising tension with the US.
On the political front, we don’t expect the US-China relationship to improve significantly under the Biden administration, although the two countries might collaborate on matters such as fighting climate change and COVID-19. Meanwhile, the delisting of Chinese stocks in the US seems to have had a positive impact on the Hong Kong stock exchange, as investors in mainland China are shifting attention to the cheaply valued Hong Kong listed stocks. This helps the Hang Seng Index to be among the best performers in the region so far this year. This trend is expected to continue, with investors shifting out of A-shares to H-shares. We continue to have high convictions that the companies we hold in this region will outperform, supported by their competitive product and offerings, and solid balance sheet.
COMMENTARY
January 27, 2014
Dear clients and colleagues,
We recently had a chance to meet with over 40 companies based in Germany and France. Here are some thoughts on the two biggest European countries and our views for 2014.
France
The main topics of discussion in France remain on how they can stimulate their job market and economy while engaging in much needed reforms. The government is now accelerating measures to improve France’s competitiveness and tackle its fiscal deficit. President Hollande just announced that €30 Billion in employer contributions for family allowances will be eliminated by 2017. There is also a strong willingness to streamline business regulations and bureaucracies to support the manufacturing sector.
Regarding fiscal issues, France is committed to cut public spending by €50 Billion between 2015 and 2017, on top of an additional €15 Billion for this year. France has little room to maneuver and finally politicians have realized the importance of reforms. Let’s hope that these announcements will translate into real actions sometime soon.
Germany
Germany’s strong economic performance should remain intact for 2014. The German model, which relies on leading edge technology to produce highly desirable products, should continue to deliver good performance overall. Automotive, Cap goods and Technology companies should do especially well. Despite the currency headwinds that German exporters are facing, most companies expect to maintain or increase their operating margins. One reason being that companies remain very much focused on bringing down their cost base. Even 5 years after the financial crises, rigorous restructuring programs are still on the agenda. Finally, we feel like the introduction of a minimum wage by 2015 and an increase in workers benefits would stimulate domestic consumption.
European markets
We see growth accelerating in 2014 but at very slow pace. In this context of anemic growth, we anticipate small caps to outperform their larger counterparts. In our view, European stocks offer better margins expansion and thus, more re-ratings potential than most other regions. Europe in general remains under-owned in many portfolios and we anticipate a gradual capital inflow to the region.
Balance sheets at corporate levels are sound and most of the deleveraging has been done. Corporate leverage is approaching its bottom level of 1995-1997 when the net debt to capital was around 40%.
Healthy balance sheets and an improvement in business sentiment could trigger an acceleration of M&A activities. A potential pick-up in M&A, even a small one, would be very beneficial for smaller companies. Keep in mind that more than 96% of all deals come from companies with less than 5 Billon dollars in market cap.
The Global Alpha Team
This report is provided solely for informational purposes and nothing in this document constitutes an offer or a solicitation of an offer to purchase any security. This report has no regard to the specific investment objectives, financial situation or particular needs of any specific recipient and does not constitute a representation that any investment strategy is suitable or appropriate to a recipient’s individual circumstances. Global Alpha Capital Management Ltd. (Global Alpha) in no case directly or implicitly guarantees the future value of securities mentioned in this document. The opinions expressed herein are based on Global Alpha’s analysis as at the date of this report, and any opinions, projections or estimates may be changed without notice. Global Alpha, its affiliates, directors, officers and employees may buy, sell or hold a position in securities of a company(ies) mentioned herein. The particulars contained herein were obtained from sources, which Global believes to be reliable but Global Alpha makes no representation or warranty as to the completeness or accuracy of the information contained herein and accepts no responsibility or liability for loss or damage arising from the receipt or use of this document or its contents. Performance figures are stated in Canadian dollars and are net of trading costs and gross of operating expenses and management fees. Further information about the Global Small Cap Composite is available by contacting the firm. Global Alpha Capital Management Ltd. (Global Alpha) claims compliance with the Global Investment Performance Standards (GIPS ®) and has prepared and presented this report in compliance with the GIPS. Global Alpha has not been independently verified.
In the game Monopoly, the property names all come from real places in Atlantic City, New Jersey. You might remember that four of the properties are railroads, and that one is the “Short Line Railroad”. This name is an exception because there was no Short Line Railroad in Atlantic City. The name is a contraction of “Shore Fast Line”, a railroad that did run there in the first half of the twentieth century.
In the business world, short-line railroads are the small stretches of track that spur off the main national networks. Typically, they provide first- and last-mile rail transportation and storage for their customers. There are about 550 of these short lines in the US and 60 or so in Canada, and they are usually privately owned. In 2019, the Private Client Infrastructure Portfolio joined with a team of seasoned operators in this space and purchased its first short-line rail asset in Sarnia, Ontario. Early experience in operating this asset has been positive, with financial results exceeding base case expectations.
In August 2020, the portfolio bought its second and third short-line rail assets in Louisiana and Texas, expanding the Private Client Infrastructure Portfolio’s geographic scope and further diversifying its overall portfolio of infrastructure investments.
Short-line rail assets occupy entrenched positions with their customers and produce strong and stable cash profits. Rail is also a business that requires active management and, in return, can experience growing profits over time as well as provide protection against inflation.
Even with the challenges of running a business during the COVID-19 pandemic, the short-line rail assets have proven to be resilient investments, due in part to short-line rail’s persistent, defensible characteristics. These include providing essential services to well-established, large-scale customers; operating in resilient markets with high barriers to entry; and having strong customer relationships, often with contracted revenues.
Infrastructure, along with real estate and private loans, are alternative assets that, where appropriate, comprise a modest part of our clients’ well-diversified investment portfolios. They can help improve the balance between the returns achieved by the portfolios and the risk required to generate those returns—which can be even more rewarding than playing monopoly and winning second prize in a beauty contest.
This post is for information only and is not intended as investment advice. The views expressed are those of the author at the time of publication and are subject to change at any time.
Although total deal value is still down 6% to $3.5 trillion for 2020, more than two-thirds of the activity happened between July and December[1]. The fourth quarter of 2020 alone saw a 39% year over year increase in announced M&A deals from 2019. Further, December was the fourth strongest month in history for M&A revenue. It is not just a high volume of small transactions; mega deal announcements have been all over the news. Such examples include the S&P Global acquisition of IHS Markit for $39 billion, the Salesforce acquisition of Slack for $27 billion, and AON’s acquisition of Willis Towers Watson for $30 billion.
So, how is 2021 looking, compared to the second half of 2020? It appears unlikely to be any different. As management teams begin reflecting on what a post-COVID future looks like, we expect that companies will reposition themselves to adjust to shifting consumer behaviour, created by COVID. A quarterly survey of global CEO confidence reached a high of 64 in Q3 2020, after bottoming to 36 at the beginning of the year (like with Purchasing Managers’ Index (PMI), ratings above 50 are positive and below are negative)[2]. That same report highlighted that of the CEOs surveyed, 36% plan to increase their capital spending over the next 12 months, compared to their previous expectations. Given the recent political changes in the US, it appears likely that the next CEO confidence survey will show even more optimism.
Furthermore, many industries, such as travel, entertainment and energy, are still near their multi-year low; this makes companies attractive targets at their current valuation. While the initial expectation was that many names in these industries would go bankrupt, all-time low interest rates and massive liquidity injections made it so that they only had to load their balance sheet with more debts to stay afloat. These factors make it likely that the record high of $1.5 trillion cash that private equity funds currently hold will be put to work during the year. As opportunities become clearer, we will see a record year for M&A and other investment banking activities.
As for the important question on everyone’s mind: how is Global Alpha getting exposure to this? We own Rothschild & Co (ROTH PA), among other names. Founded in 1838 by the famous Rothschild family, Rothschild & Co is one of the world’s largest independent financial advisory groups, with headquarters in Paris, France. The company provides M&A, strategy and financing advice, as well as investment and wealth management. With 50 offices and 3,500 employees, the company has a foothold in over 40 countries, and it is still more than 60% family-owned. As a boutique firm, Rothschild also benefits from a favorable reputation in comparison to larger banks, as well as the trend of using more advisors to conduct individual deals. In 2019, boutique firms accounted for 22% of advisory deal value versus only 9% in 2000; its share is expected to keep increasing over the next decade.
Historically, the firm’s activities centered on its global financial advisory and its wealth and asset management businesses. A little more than a decade ago, Rothschild added a new private equity business that now represents 8% of their revenue, but 17% of their profit share, representing a new growth driver for them. It is also the reason that Rothschild is able to maintain a better margin profile than its peers. Additionally, this allows the firm to deploy its own capital alongside their institutional clients and incorporate strong ESG principles in its investment decisions.
Within its global financial advisory business, Rothschild employs more than 1,100 advisors, and derives two-thirds of its revenue from pure M&A, with the balance from capital markets financing. Rothschild ranks sixth in revenue globally and first in Europe for its investment banking business. We are confident that the company will be able to benefit from the current environment.
SWOT:
Strengths
Leader in the European Union, consistently gaining market shares
Global money trends continue to suggest a near-term economic slowdown, with the caveat that interpretation of US monetary statistics is complicated by recent regulatory changes.
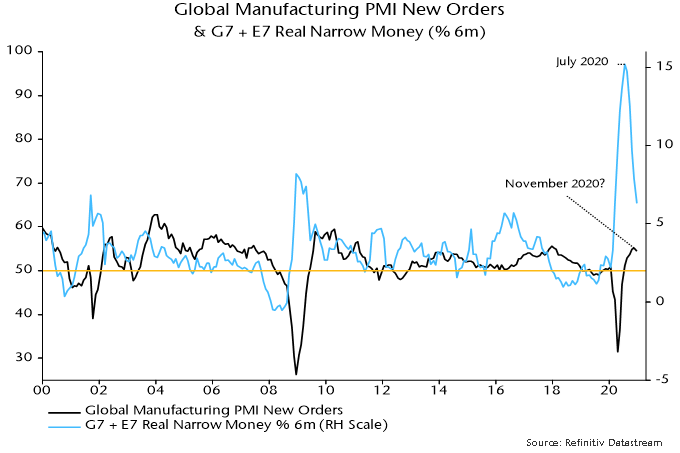
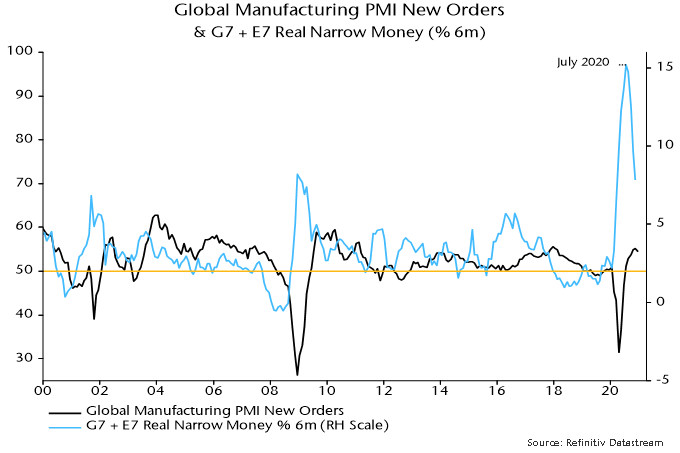
The key global monetary indicator followed here – six-month growth of real narrow money in the G7 economies and seven large emerging economies – is estimated to have fallen further in December, based on monetary data covering 70% of the aggregate. Real money growth has led the global manufacturing PMI new orders index by 6-7 months on average historically, so the continued decline from a July 2020 peak suggests that this PMI measure will move lower into Q2 – see chart 1.
Chart 1
An important qualification is that the G7 plus E7 money numbers for November / December incorporate an adjustment to US data to correct for an apparent upward distortion due to some banks reclassifying savings deposits (excluded from M1 and related measures) as demand deposits (included).
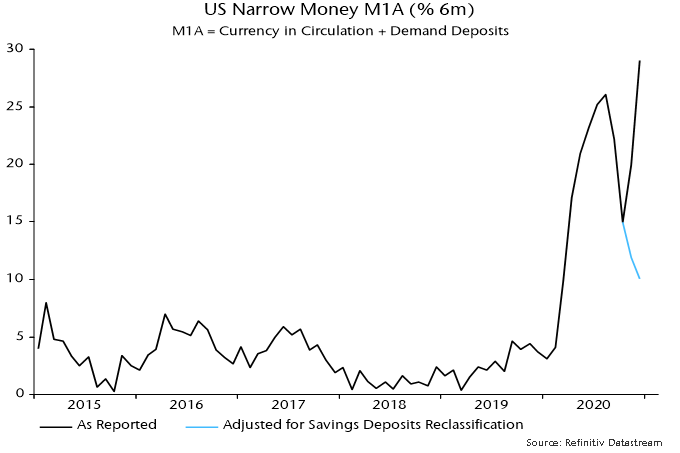
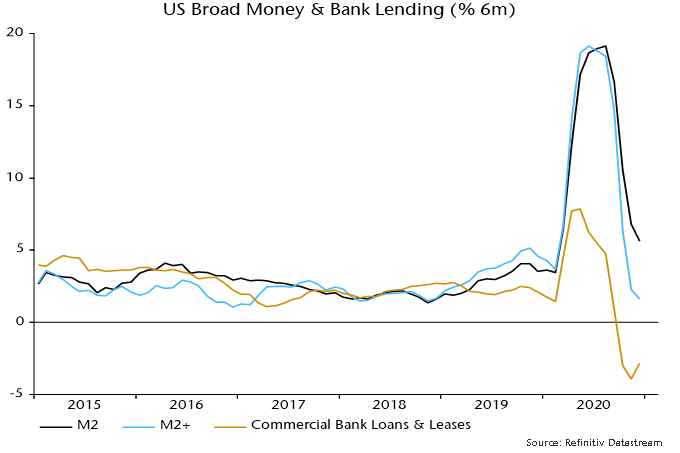
Excluding this adjustment, six-month growth of US narrow money rose to a new high at year-end – see chart 2. Some monetary observers ignore or are unaware of the reclassification distortion, arguing that the narrow money surge presages a super-strong economy and sharply higher inflation.
Chart 2
Fed statisticians haven’t responded to a request for confirmation of a reclassification effect on the data. The view that the strong November / December numbers are explained by such an effect – rather than a genuine flow of money out of “inert” savings deposits into “high velocity” demand deposits – rests on three considerations.
First, the Fed indicated that deposit reclassifications would occur following its decisions to cut reserve requirements on transactions deposits to zero and remove restrictions on withdrawals from savings deposits last spring.
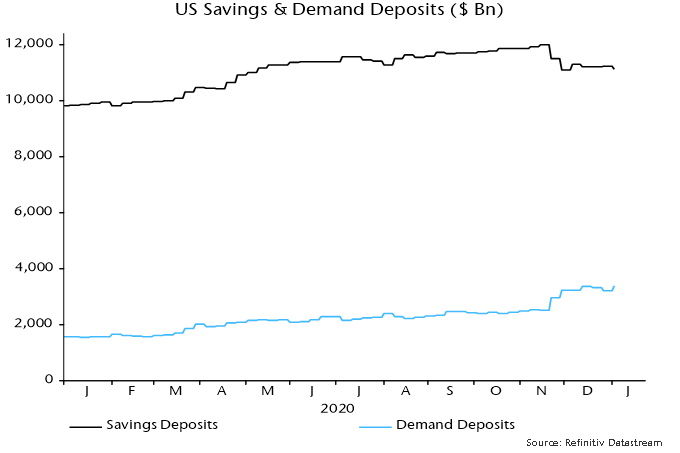
Secondly, the big fall in savings deposits and corresponding rise in demand deposits occurred between the weeks ending 16 November and 30 November – see chart 3. Movements outside this two-week window were “normal”. The weekly numbers are averages of daily data, so the reclassification is likely to have occurred during the week ending 23 November, with the effect carrying over into the following week. (The alternative view is that US election results triggered a big movement of money.)
Chart 3
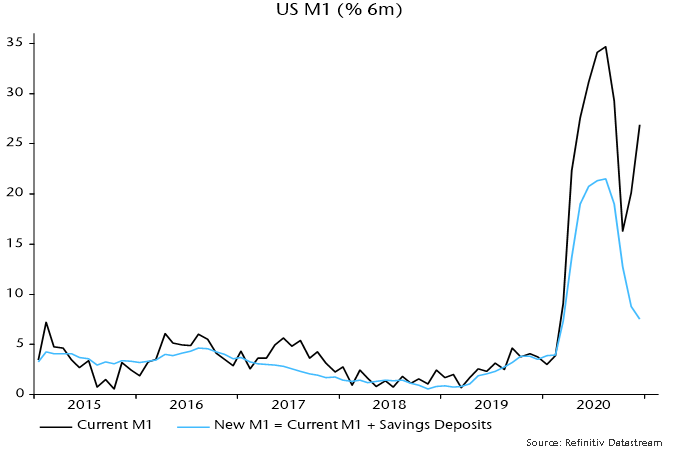
Thirdly, the Fed implicitly acknowledged that the M1 data have become distorted in its decision to redefine the aggregate to include savings deposits from next month. Six-month growth of the new M1 measure continued to slide in November / December – see chart 4.
Chart 4
The suggestion that US monetary conditions have become less expansionary is supported by broad money trends, while bank lending continued to contract into year-end (with weakness not due to PPP loan forgiveness, which has yet to kick in) – see chart 5.
Chart 5
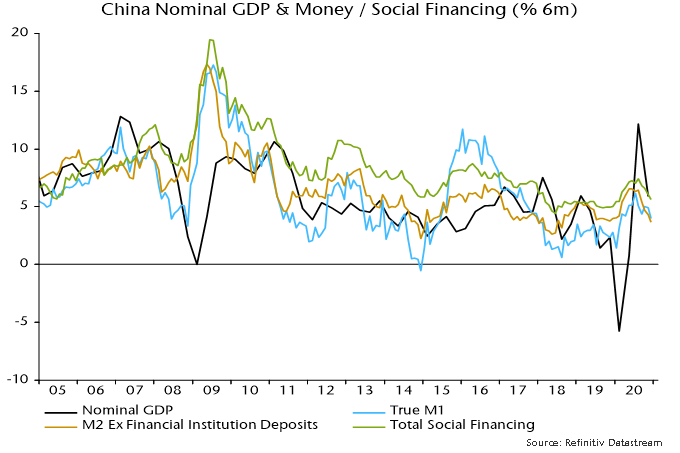
The fall in global six-month real narrow money growth in December also reflected declines in China, Japan and Brazil. The further slowdown in China – extending to broad money and credit, as shown in chart 6 – is consistent with the view here that PBoC policy is too tight and Chinese economic news is likely to disappoint in early 2021. A dovish PBoC policy shift may be needed to trigger the next leg of the global reflation trade but isn’t expected by the consensus and could be conditional on a prior market setback.
Markets overview
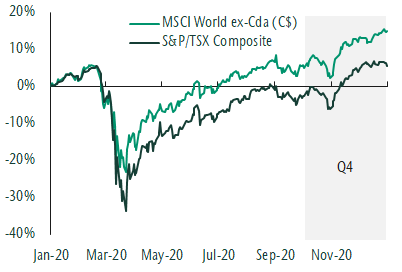
Equity market returns were strong this quarter as the global economy continued to show signs of healing in the face of rising virus cases and more shutdowns. The S&P/TSX Composite Index was up 9.0% and the MSCI World ex Canada Index (C$) advanced 8.8% this quarter. The start of November marked a significant inflection point for markets. The US election resulted in some short-term market volatility which subsided. This was followed by the clearly positive news of an approved COVID-19 vaccine. A better vaccine that is available to people faster than previously expected provides a boost to the economic outlook, even if it does take many months to distribute widely. This has allowed investors to look beyond near-term economic uncertainty to a more normal environment. A shift in market leadership followed as investors bought companies that were most negatively affected by lockdowns and stood to benefit the most from an eventual end of the pandemic. In addition, assets that are more sensitive to the economic cycle began to outperform. This includes cyclical sectors like energy and financials as well as asset classes like global small cap stocks.
Equity markets reach new highs in Q4
Source: Refinitiv
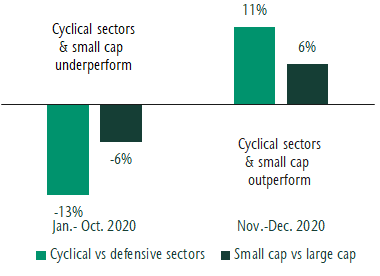
Significant shift in market leadership
Sector returns are for the MSCI World. Cyclical sectors include materials, energy, consumer discretionary, financials and real estate. Defensive sectors include consumer staples, health care and utilities. Small cap returns are based on the MSCI World Small Cap Index and large cap returns are for the MSCI World Index. All returns in Canadian dollars. Source: Refinitiv
Bond returns were mixed this quarter. Government and provincial bonds were modestly negative and corporate bonds generated positive returns. The net result was that the FTSE Canada Universe Bond Index returned 0.6% for the quarter. High yield bonds, like equities, benefited from an improved investor outlook. Despite default rates remaining elevated, demand for these investments has been strong and yields have tightened.
Our thoughts
We have been seeing a recovery in the economy unfolding for some time and have positioned portfolios accordingly. We have maintained an overweight to equities with a bias to global stocks. We have increased our weight to asset classes that tend to do well in a recovery such as small cap stocks. This quarter we sold core bonds and bought high yield bonds as credit conditions improved. This is consistent with the beginning of a new business cycle which historically coincides with improving returns for high yield.
Overall our equity teams continue to own resilient, stable businesses that have higher earnings growth than the market. Through the recovery we have selectively added more cyclical companies standing to benefit from an improving outlook and the start of a new business cycle. Within Canada this means increasing exposure to banks and energy companies. Within our global strategy we remain overweight emerging markets and have reduced the underweight to financials and increased positioning in select leisure companies. Within fixed income we are overweight credit and inflation-protected debt. Our positioning has benefited clients well this quarter and year.
From the desk of Jeff Guise, Managing Director, Chief Investment Officer, CC&L Private Capital.
This post is for information only and is not intended as investment advice. The views expressed are those of the author at the time of publication and are subject to change at any time.
FOR IMMEDIATE RELEASE
CONNOR, CLARK & LUNN INFRASTRUCTURE CLOSES U.S. RENEWABLE POWER INVESTMENT
TORONTO, JANUARY 11, 2021
Connor, Clark & Lunn Infrastructure (CC&L Infrastructure) is pleased to announce that it has completed its previously announced acquisition of an 80% equity interest in a U.S. wind and solar portfolio.
This transaction, which was completed alongside Régime de Rentes du Mouvement Desjardins and Desjardins Financial Security Life Assurance Company (together, Desjardins Group), included the purchase of four operating wind projects and one construction-stage solar project located in Indiana, Wisconsin, Oklahoma, and Ohio. Each asset is fully contracted through long-term power purchase agreements with high-quality offtakers, and the portfolio provides geographically diversified exposure to three distinct U.S. electricity markets. Construction of the solar facility began in December 2020 and is expected to be operational later this year or early in 2022.
“Completing this investment achieves an exciting milestone for our business,” said Matt O’Brien, President of CC&L Infrastructure. “The addition of these projects increases the total capacity of our renewable power portfolio well past a gigawatt globally. We look forward to operating these high-quality projects alongside our partners over the coming years.”
CC&L Infrastructure now owns approximately 1.4 GW of renewable power globally, with more than 1GW in operation. On a combined basis, these operating facilities are expected to produce approximately 4 million MW hours of clean energy each year – enough energy to power more than 320,000 homes and offset the equivalent greenhouse gas emissions of more than 600,000 passenger vehicles for a year.
About Connor, Clark & Lunn Infrastructure
CC&L Infrastructure invests in middle-market infrastructure and infrastructure-like assets with highly attractive risk-return characteristics, long lives and the potential to generate stable cash flows. CC&L Infrastructure is a part of Connor, Clark & Lunn Financial Group Ltd., a multi-boutique asset management firm whose affiliates collectively manage over CAD$85 billion in assets. For more information, please visit www.cclinfrastructure.com.
Contact
Kaitlin Blainey Director Connor, Clark & Lunn Infrastructure (416) 216-8047 [email protected]
The forecasting approach employed here – relying on monetary and cycle analysis – turned positive on the global economy and risk markets in early Q2 2020 but is giving a more cautionary message at the start of 2021. The suggestion is that underlying economic momentum will slow temporarily while monetary support for markets has diminished, together raising the risk of a correction. The central view remains that global growth will be strong over the course of 2021 as a whole but with the adverse corollary of a significant pick-up in inflation into 2022.
The monetary aspect of the forecasting approach can be summarised as “real money leads the economy while excess money drives markets”. Six-month growth of real (i.e. inflation-adjusted) narrow money in the G7 economies and seven large emerging economies (the “E7”) was weak at the start of 2020 but surged from March, correctly signalling a strong rebound in global economic activity during H2.
Real money growth, however, peaked in July, falling steadily through November, the latest data point – see chart 1. Turning points in real money growth have led turning points in the global manufacturing PMI new orders index – a key coincident indicator – by 6-7 months on average historically, suggesting that the PMI will move lower in early 2021. The level of money growth remains high, arguing against economic weakness (except due to “lockdowns”), but a directional shift in activity momentum could act as a near-term drag on cyclical assets.
Chart 1
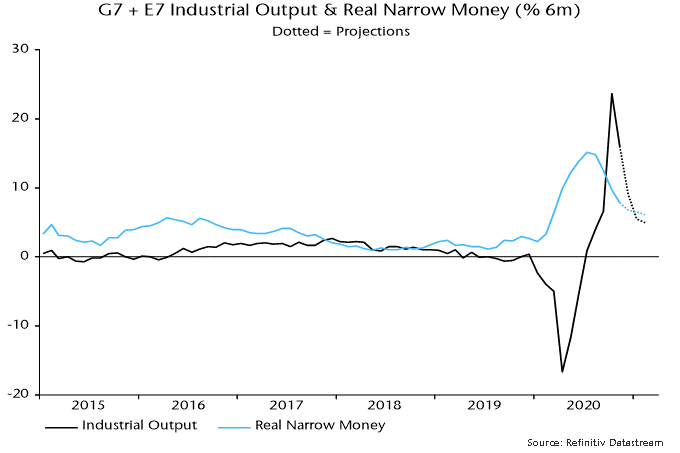
“Excess” money refers to an environment in which actual real money growth exceeds the level required to support economic expansion, with the surplus likely to be invested in markets. Two gauges of excess money are monitored here: the gap between six-month growth rates of G7 plus E7 real narrow money and industrial output, and the deviation of year-on-year real money growth from a long-run moving average. Historically, global equities performed best on average when both measures were positive, worst when they were negative, and were lacklustre when they gave conflicting signals.
Following a joint positive signal (allowing for data release lags) at end-April 2020, the measures became conflicting again at end-December – year-on-year real money growth remains well above its long-run average but six-month growth fell below that of industrial output in October / November. Markets, therefore, may no longer enjoy a monetary “cushion” against unfavourable news, including the expected PMI roll-over.
The expectation here is that markets will become more volatile but risk assets are unlikely to be outright weak – any sizeable set-back would probably represent another buying opportunity. As noted, real money growth remains at an expansionary level and may stabilise soon, while the cycle analysis is giving a positive economic message for the next 12+ months, as explained below.
The cross-over of six-month real narrow money growth below industrial output growth, moreover, could prove short-lived, with output momentum about to fall back sharply as positive base effects fade. Assuming a stabilisation of monthly money growth, a positive differential could be restored as early as January – see chart 2 – in which case the assessment of the monetary backdrop for markets would shift back to favourable from Q2.
Chart 2
The cycle analysis provides a medium-term perspective and acts as a cross-check of the monetary analysis. There are three key economic activity cycles: the stockbuilding or inventory cycle, which averages 3.5 years (i.e. from low to low); a 9-year business investment cycle; and a longer-term housing cycle averaging 18 years. These cycles are essentially global in nature although housing cycles in individual countries can sometimes become desynchronised.
The cycle analysis was cautionary at the start of 2020, reflecting a judgement that the stockbuilding and business investment cycles were in downswings that might not complete until mid-year. The covid shock magnified but ended these downswings, with both cycles bottoming in Q2 and entering a recovery phase in H2. With the housing cycle still in an upswing from a 2009 low, all three cycles are now acting to lift global economic momentum.
The next scheduled cycle trough is a low in the stockbuilding cycle, due to be reached in late 2023 if the current cycle conforms to the average 3.5 year length. The downswing into this low would probably start about 18 months earlier, i.e. around Q2 2022. The cycle analysis, therefore, is giving an “all-clear” signal for the global economy for the next 15-18 months, implying that any data weakness – such as suggested by monetary trends for early 2021 – is likely to be minor and temporary.
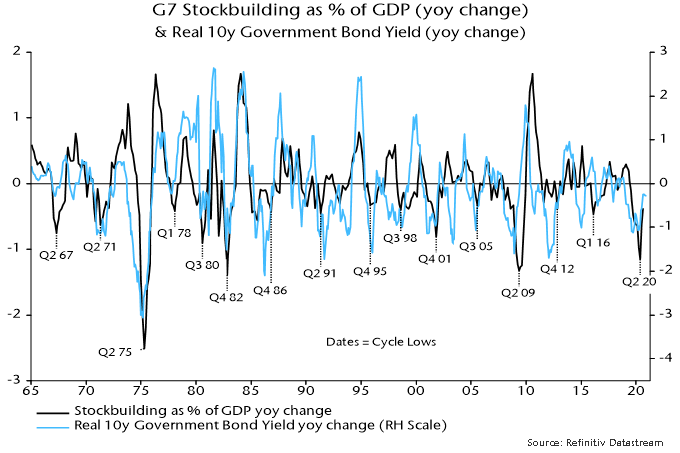
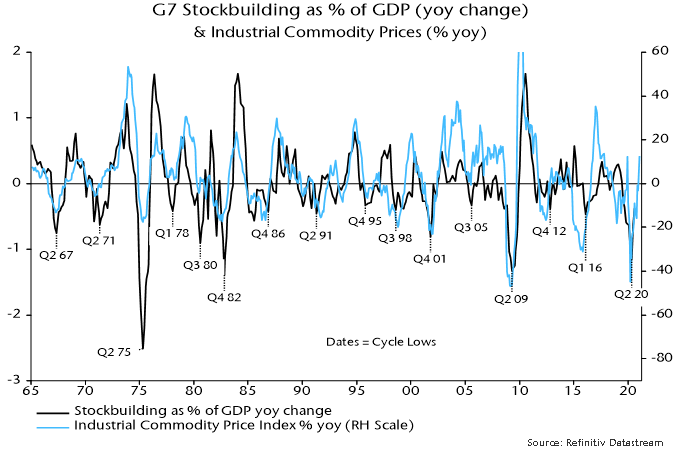
Financial market behaviour is strongly correlated with the stockbuilding cycle in particular. Cycle upswings are usually associated with rising real government bond yields and strong commodity markets – see charts 3 and 4 – as well as low / falling credit spreads and outperformance of cyclical equity sectors. The latter three of these trends, of course, were in place during H2 2020 and may extend during 2021 after a possible Q1 correction. A surprise to the consensus in 2021 could be a rebound in real bond yields, which would challenge current equity market valuations and could favour “value”.
Chart 3
Chart 4
To sum up, monetary data in early 2021 will be important for the strategy assessment here. The current monetary backdrop and possible weaker near-term economic data suggest reducing cyclical exposure relative to H2 2020 but a stabilisation or revival in real money growth would support the positive message from the cycle analysis, arguing for using any setback in cyclical markets to rebuild positions in anticipation of a strong H2.
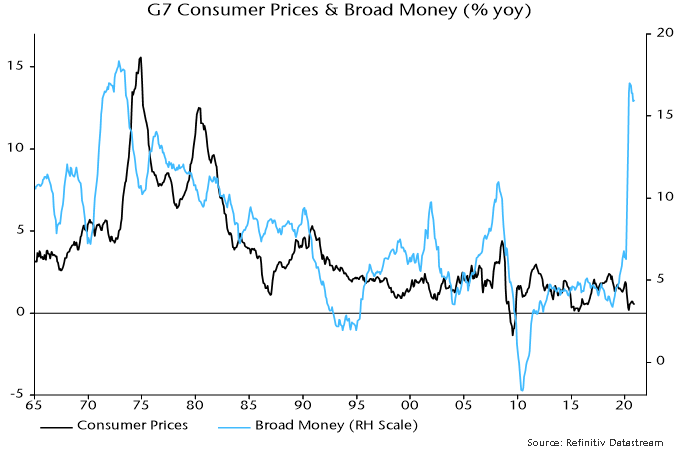
Consumer price inflation rates are widely expected to rise during H1 2021, reflecting recent commodity price strength, a reversal of temporary tax cuts (Germany / UK) or subsidies (Japan), and base effects. The policy-maker and market consensus is that this will represent a temporary “cyclical” move of the sort experienced regularly in recent decades. The suspicion here is that it will prove more lasting and significant, because the monetary backdrop is much more expansionary / inflationary than before those prior run-ups.
Broad rather than narrow money trends are key for assessing medium-term inflation prospects. This is illustrated by Japan’s post-bubble experience: narrow money has grown strongly on occasions but annual broad money expansion never rose above 5% over 1992-2019, averaging just 2.1% – the monetary basis for sustained low inflation / mild deflation. Similarly, G7 annual broad money growth averaged only 3.7% in the post-GFC decade (i.e. 2010-19).
2020 may have marked a transformational break in monetary trends. G7 annual broad money growth peaked at 17.0% in June, the fastest since 1973 – see chart 5. Monthly growth has subsided but there has been no “payback” of the H1 surge. At the very least, this suggests a larger-than-normal “cyclical” upswing in inflation in 2021-22. Ongoing monetary financing of large fiscal deficits may sustain broad money growth at well above its levels of recent decades, embedding the inflation shift.
Chart 5
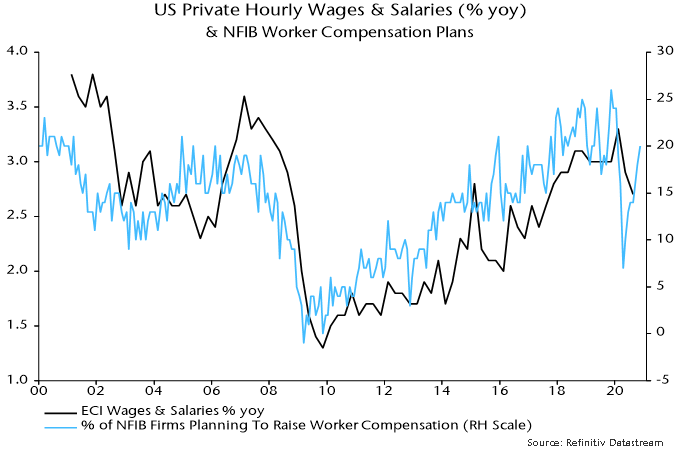
The consensus view that an inflation pick-up will prove temporary rests on weak labour markets bearing down on wage growth. Unemployment rates adjusted for short-time working / furlough schemes, however, fell sharply as the global economy rebounded in H2 2020 and structural rates have probably risen – labour market “slack”, therefore, may be less than widely thought and much lower than after the 2008-09 recession. The slowdown in wages to date has been modest and some business surveys are already hinting at a rebound – see chart 6.
Chart 6
Commentators who take seriously the prospect of a sustained inflation rise often argue that real bond yields would take the strain by moving deeper into negative territory, the view being that central banks will cap nominal yields. Such a scenario would be bullish for risk assets but probably overstates the power of the policy emperors. Pegged official rates and a QE flow currently running at about 10% of the (rapidly rising) outstanding stock of G7 government bonds per annum could prove insufficient to offset selling by existing holders in the event of an unexpected inflation surge.