Kuwait skyline view from beach at night.

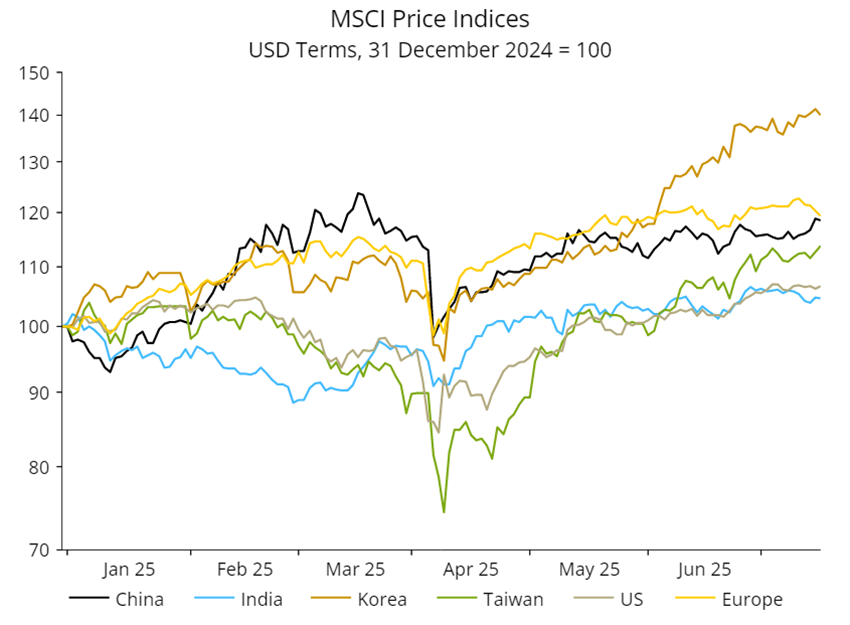
MENA equity markets ended the second quarter of 2025 with returns of 1.3% for the S&P Pan Arab Composite LargeMidCap Index versus the MSCI Emerging Markets Index which was up 12.0% in the same period. For the year-to-date end of June 30, MENA markets were up 4.0% compared to 15.3% for emerging markets (EM).

The significant underperformance of MENA versus EM in the first half of the year should not come as a surprise. In our last letter, we flagged the risk of regional underperformance in a weak oil/weak USD environment that has characterised much of the first half of 2025. The under-indexation of MENA equities to the AI theme (a similar dynamic to what is observed in the underperformance of India equities this year) is another source of performance drag versus EM in the period.

Return dispersion among MENA equity markets is a desirable feature that we highlighted in previous letters and one that we feel is underappreciated by asset allocators. This dispersion allows us to step in and out of countries (on a relative basis) depending on our assessment of risk-reward in each. The first half provided a particularly good example of dispersion with a performance gap of ~25% between Kuwait (best performing) and Saudi Arabia (worst performing). Kuwait’s strong performance this year is being driven by increasing optimism on policy reform. However, our conversations with Kuwaiti companies in the last two months suggest a slower pace of execution, which is also visible in underwhelming earnings so far this year. Kuwait in 2025 is therefore likely to be a multiples expansion story that we believe has mostly played out. We therefore look for earnings growth in 2026 to support valuations or otherwise see scope for disappointment in the market.

In the interim, the market will still trade the headlines (particularly news on the mortgage law) and as a result we expect valuations to remain underpinned but not necessarily offering much upside.

The UAE also had an exceptional run that is extending into July and continues to stretch the performance gap with Saudi Arabia year-to-date. Fundamentals have largely supported the UAE-Saudi performance differential, as evidenced by comparing their respective banking systems’ loan-to-deposit ratio. UAE banks are leveraging their liquidity advantage to grow in the region, with an increasing share of their loan book growth attributed to Saudi Arabia.

Macro data appears supportive of the UAE and suggests an extension of a very strong three-year cycle well into 2025. While we acknowledge the strengths of the UAE macro story, we are wary of the stretched positioning in certain stocks and, as a result, have been gradually tilting the portfolio to end-of-cycle stocks that appear less crowded and thus offer a more attractive risk-reward. This has so far proven premature as the market continues to be emboldened by solid earnings growth and positive macro data. On the other hand, Saudi valuations present an opportunity to gradually build positions in companies we like with a 12-to-18-month view. We also see Qatar as a dark horse market this year, given relatively low levels of ownership amidst an effort by the regulator to prop up interest in its market.

In our last outlook statement, we discussed the impact of tariffs on the region. The conclusion then and now is that the region’s net import position with the United States will mitigate any direct negative impact, but that the indirect impact through a lower oil price can be significant. While peak tariff noise has largely subsided, we expect it to continue to be an area of tension as the pace of negotiations and deals accelerates. A possible change in strategy by OPEC+ also risks adding more supply to the market and can result in downside pressure on the oil price as we exit the seasonal peak summer demand. Our working assumption is that oil stays in the mid-$60s for the rest of the year; this is a level we consider to be a sweet spot for the region as it secures the funding of key viable projects while acting as a natural mitigant to unproductive capital and operating expenditures. Recent announcements on giga-project scope and feasibility reviews might be taken negatively by the market initially (most recently “The Line” project), but we believe this signals a commonsense approach to spending and resource allocation. Mid-$60s oil might have an impact on equity market sentiment in Saudi Arabia, but the offset to that is the valuation environment appears conducive for good stock pickers.

The primary reason tariffs took a backseat in the headlines in the second quarter was the unprecedented escalation in hostilities between Israel and Iran in June. MENA investors have long grappled with the prospect of direct strikes between the two countries with most (us included) placing this in the “low probability/high impact” risk bucket. As the events played out – and contrary to most expectations – MENA markets proved resilient, ending up at 1.7% over the 12 days of escalation. Brent oil briefly flirted with $82 on June 23 before settling back down to a range of $67-68 hours later. With the benefit of hindsight, markets were quick to recognise that Iran’s capacity to defend itself or launch retaliatory strikes was severely curtailed and as a result, swiftly discounted a prompt resolution to the events (paralleling an even stronger rally in Israeli equities over that period). While we do not rule out further escalation in the future, MENA equity markets passed a major stress test in June. In fact, a strong argument can be made that the political risk premium attached to the region (particularly GCC equity markets) is lower than at any point in their history.

We look forward to updating you on the strategy in the next letter.

Touristic sightseeing ships in Istanbul, Turkey.

The strategy focuses on investing in frontier and emerging market companies that our team expects will benefit from demographic trends, changing consumer behaviour, policy and regulatory reform and technological advancements.

Below, we explore several key factors that influenced returns during the second quarter of 2025 and share observations on the portfolio and the markets.

Internet and technology portfolio

The portfolio’s returns in the second quarter and throughout the first half of the year was primarily driven by the internet and technology sector. Key contributors included Fawry for Banking Technology & Payments S.A.E. (FWRY EG), Baltic Classifieds Group PLC (BCG LN) and Allegro.EU SA (ALE PW) which have been discussed in detail in previous letters. It is worth mentioning that Allegro shares benefited from a very strong Polish equity market backdrop this year with the WIG20 Index up ~30% in zloty terms as of end of June 2025. Fortunately, fundamentals have also been very supportive; expectations are for mid-teens EBITDA growth in 2025 and the company has allocated 4% of market capitalisation in share buybacks. The company’s decision to diversify its last-mile logistics (primarily parcel lockers) and reduce reliance on the dominant provider InPost can generate operational efficiencies and support margins if executed properly (for context, Allegro’s shares have outperformed InPost’s by 45% in constant currency since the announcement of Allegro’s new strategy in March this year). We also finally see a path to a clearing of the multi-year share overhang from private equity ownership as share sales are absorbed well by the markets, aided by passive index trackers which systematically react to increases in free float market capitalisation.

One drag in the internet and technology portfolio that is worth mentioning is Talabat Holding Plc (TALABAT AE), the leading food delivery and quick commerce company in the Middle East and Africa region. While we have reservations on the quality of food delivery business models, we found Talabat’s market penetration, diverse geographical dominance and valuation appealing. The company’s monetisation model impressed us; it generates 3.5% of gross merchandise value in advertising income (AdTech) and has built a healthy but competitive take-rate model from restaurant partners and consumers. Additionally, Talabat’s grocery offering (quick commerce) is the most developed we’ve seen among food delivery companies in the region with ~25% revenue contribution. We believe the market is overly concerned with competitive risks arising from the entry of Keeta (a Meituan company) into key Talabat markets like the UAE, Kuwait and Qatar. This has resulted in a fading of Talabat’s forward P/E ratio from ~18x at IPO last year to under 12x. This is a significant discount to domestic and global peers that are inferior on almost every metric. Talabat is a small position for the strategy and we acknowledge that the multiple is likely to be supressed until there is visibility on Keeta’s capabilities in its key markets. That said, we see a favourable risk-reward set up for the shares on the view that Talabat’s margins will exhibit resilience (relative to market expectations) in the next 12-18 months as Keeta enters the market.

Industrials portfolio

The industrials portfolio was a bright spot for the strategy with solid outperformance in the shares of Malaysian companies Westports Holdings Bhd (WPRTS KL) and Kelington Group Bhd (KGB KL).

Westports is a leading Malaysian port operator based in Port Klang, strategically located along the Straits of Malacca. It serves as a major gateway for container and conventional cargo for central Peninsular Malaysia and is one of the region’s key transshipment hubs, competing with the likes of Port of Tanjung Pelepas (PTP) and Port of Singapore. We acquired shares in Westports in the quarter as they came under pressure from concerns on slowing global trade from tariffs. Our thesis on Westports was that the volumes it handles will be relatively resilient given low exposure to Asia-US trade flow and relatively high exposure to gateway traffic (~50% of 2024 revenue are on containers destined to Malaysia as an end market). We also saw option value in the shares as the market was not pricing in a potential regulatory rate hike. Much to our delight, this was gazetted soon after we invested in the company and led to a significant upward revision of earnings across the street that supported the rally in the shares.

Kelington is a founder-led engineering solutions provider with a core competency in Ultra-High Purity (UHP) gas and chemical delivery systems for semiconductor, flat-panel display, solar and LED manufacturers. We purchased Kelington shares in the fourth quarter of 2024 and continued to build a position in the company as we got more familiar with the management team and the business model. We like Kelington for its UHP solutions business in particular; UHP systems are engineered networks that transport and regulate gases and chemicals used in semiconductor fabrication. These systems must maintain purity levels of 99.9999% (6N) or higher, as even microscopic contaminants can ruin wafers or reduce yield. We expect Kelington to be a major beneficiary of the “semiconductor sovereignty” theme and are bullish on its ability to capture that growth over the next few years.

The strategy experienced some underperformance (relative to the performance of the industrial portfolio) from TAV Havalimanlari Holding AS (TAVHL IS). TAV is a Turkish-listed airport operator and services company with a portfolio of 77 airports in 19 countries which it manages directly or through co-management agreements with industry partners. TAV shares came under pressure following the escalation in the Middle East in June as concerns over air travel and tourism mounted. We saw an opportunity to add to the shares after the US-mediated ceasefire was reached. We are relatively early in our ownership of TAV but are impressed with its track record and exposure to unique airport assets in regions that will experience long-term growth in air travel.

Healthcare and education portfolio

The healthcare and education portfolio had a good quarter led by Benefit Systems SA (BFT WA). BFT provides non-payroll employee benefit solutions with a strong focus on fitness, wellness and lifestyle service in its home market of Poland and several regional markets including Czechia, Slovakia, Bulgaria, Croatia and Türkiye. BFT is a play on the growth in wellness and corporate HR budgets. It dominates the Polish B2B wellness market with a base of ~1.7 million cards (~70% of the market). In addition to being a key customer acquisition channel for third-party fitness clubs, BFT operates its own network of over 240 clubs which helps it maintain healthy site utilisation, good user experience and a strong bargaining position vis-à-vis third-party clubs. BFT’s management has been vocal about its regional ambitions and followed that through this year with a ~USD430 million acquisition of Türkiye’s leading fitness club operator MACFit. BFT is betting that it can leverage MACFit’s 121 club network in Türkiye to build a B2B wellness card business that is similar to the one it built in Poland. While it is early days, the MACFit asset is highly profitable and allows the company time to thoughtfully develop its B2B business in the country. There was some corporate activity on the share registry of BFT in the quarter with the founder (who is no longer involved in the business) exiting his remaining ~14% stake in the company to a very healthy book of mainly local institutional investors. This resulted in improved liquidity on the shares with daily average traded value increasing to over USD3 million a day since the transaction was completed in March from the 2024 average of USD1.4 million.

Outlook

The investment environment continues to be volatile. Erratic policy making, a shifting geopolitical landscape and mixed signals about the health of the global economy still carry a lot of future uncertainty with them. On the other hand, corporate earnings appear healthy.

With the artificial intelligence theme firmly in play, fiscal spending is on the rise across much of the Western world and valuations are buoyed by a weak US dollar and expectations of monetary easing from whoever will be running the US Fed in the next 12 months.

As discussed in our last outlook, a weak US dollar is a net positive for most of our markets as it creates breathing room for central banks to cut rates without importing inflation through currency depreciation. We see that theme intact for the time being and as such, expect a supportive environment for valuations and corporate earnings growth.

At a micro level, we continue to be encouraged by the strong pipeline of ideas that we are generating and believe that signals a healthy environment for the strategy. More importantly, and as demonstrated in some of the company examples we gave earlier, the portfolio comprises unique, high-growth companies that we believe are under-owned in an EM equity context and have the potential to generate significant capital appreciation over time.

We look forward to updating you on the strategy in the next letter.

Downtown Warsaw skyline at night.

Building on insights from our prior research visits in 2023 and 2024, we returned to Warsaw this summer to assess how Polish companies are navigating the current economic and geopolitical environment. Over the course of a week, we conducted a series of reverse roadshows, meeting with corporate executives across sectors including consumer, real estate, infrastructure, industrials, health care, technology, media and gaming. Visiting companies in their own environments, rather than at conferences, gave us a more grounded view of their strategic focus, day-to-day operations and internal culture.

While Poland is often still viewed through the lens of its post-communist past, the reality on the ground tells a very different story. Today’s Poland is a modern, outward-looking EU economy, entrepreneurial, digitally driven and increasingly integral to regional supply chains and defence infrastructure.

What stood out this year was the visible progress in urban infrastructure. Warsaw continues to modernize, supported by EU-backed investment in roads, rail and public transit. The subway system is not only clean and efficient, but also notably safe. Highways are well-maintained, and we observed more active construction than in prior visits, particularly in residential projects. These developments reflect ongoing urbanization, with growing challenges around land availability further reinforcing housing demand.

On the macro front, Poland appears to be regaining its footing. Wage growth has outpaced inflation over the past two years, helping to restore purchasing power. Unemployment remains among the lowest in the EU, and the National Bank of Poland has implemented two rate cuts in 2025, with room for further easing. That said, while household balance sheets are healthier, consumers remain selective in their spending. Management teams across sectors described a more stable but cautious demand environment.

Overall sentiment was notably more optimistic than in prior visits. While risks remain (from labour shortages and EU fund disbursement delays to geopolitical uncertainty) most companies projected confidence in their positioning. Disruption in global trade flows and ongoing tariff negotiations between the EU and the United States were also cited as areas to monitor, though their immediate impact on domestic operations has been limited.

Several structural themes emerged from our conversations. First, consolidation continues to reshape the competitive landscape in Poland. This was particularly evident in diagnostics, fitness, convenience retail and residential development. Second, an increasing number of Polish companies are executing or planning regional expansions into Central and Eastern Europe, and even Western Europe, suggesting growing confidence, scale and ambition.

We were also encouraged by the practical adoption of artificial intelligence (AI). Rather than buzzwords, companies are deploying AI to improve efficiency, customer experience and decision-making. Use cases included radiology interpretation in diagnostics, store network optimization in retail, chatbot support and workflow tools in classifieds, targeting in digital advertising and content generation in game development. These deployments are already contributing to margin enhancement and productivity gains.

Anecdotally, one leading convenience chain noted that it is now the largest seller of coffee and pizza in Poland, a testament to how local champions are reshaping consumer behaviour and capturing everyday spend.

In our view, Poland continues to offer a depth of high-quality, bottom-up ideas. It combines structural EU support with entrepreneurial dynamism, accelerating technological adoption and rising regional ambition. Our research efforts allow us to identify hidden champions early and build conviction through firsthand engagement.

Budimex SA (BDX PW)

A position we initiated earlier this year, Budimex reflects several of the structural themes we observed on the ground: public infrastructure, disciplined execution and regional relevance. The company is Poland’s largest infrastructure contractor, playing a critical role in the country’s road, rail, military and energy-related construction projects. It benefits from NATO and EU certifications that enable participation in sensitive public tenders, particularly in the defence sector.

Budimex follows an asset-light model, maintaining in-house design and project management capabilities while outsourcing labour-intensive work. This structure enhances flexibility and allows the company to scale efficiently across diverse projects.

While Poland remains its core market, Budimex is also expanding its footprint across the region, with active operations in Germany, the Czech Republic, Slovakia and the Baltics. These markets offer infrastructure demand that fits with Budimex’s core competencies and represent a natural next step in its evolution.

Poland is undergoing a historic infrastructure transformation, supported by EU cohesion funds, national defence investments and long-term energy transition plans. Budimex’s strong execution track record, disciplined bidding strategy and established relationships with key government entities make it well-positioned to benefit from this cycle.

While the company has developed capabilities in infrastructure services and maintenance, it is currently evaluating the strategic direction of that segment.

Global (i.e. G7 plus E7) six-month real narrow money momentum – a key indicator in the approach followed here – recovered in June but remains below a multi-year high reached in March.

The June rise reflected a small rebound in nominal money growth combined with a further fall in six-month consumer price momentum, to its lowest since 2020 – see chart 1.

Chart 1

Chart 1 showing G7 + E7 Real Narrow Money (% 6m)

CPI momentum is now below its 2015-19 average, vindicating the “monetarist” forecast that global inflation would fully reverse its 2021-22 spike once the ridiculous – but thankfully temporary – policy-driven money growth surge of 2020-21 had passed through the system.

The rise in six-month real narrow money momentum into March suggested that global economic growth would strengthen into late 2025, following a weak start to the year related to a monetary slowdown into October 2024.

Front-running of US tariffs, however, may have supported growth during H1, with H2 payback liable to dampen the expected pick-up. The March peak in real money momentum, meanwhile, suggests economic deceleration from late 2025.

The June rise in global real money momentum was driven by a further pick-up in India following a dovish RBI shift coupled with a surprise rebound in the US. By contrast, Eurozone momentum slowed for a third month while UK contraction intensified, almost catching down to Japan – chart 2.

Chart 2

Chart 2 showing Real Narrow Money (% 6m)

Interpretation of recent US money numbers is clouded by disruption to fiscal financing from the delay in lifting the debt ceiling. An associated run-down of the Treasury’s cash balance at the Fed may have supported H1 money growth, suggesting a drag as the balance is restored to its prior level.

(“Austrian” measures of the money stock include government deposits, on which basis US six-month narrow money momentum was negative in June. Such an approach is not endorsed here, for the obvious reason that – unlike for private sector agents – government money holdings are unrelated to future spending.)

Still, recent sideways movement of US six-month real narrow money momentum versus a slowdown in the Eurozone and outright weakness in Japan / the UK suggests improving US relative economic prospects while casting doubt on forecasts of further equity market underperformance.

UK monetary alarm bells are ringing louder.

Six-month growth of the preferred narrow money measure here – non-financial M1, comprising holdings of households and private non-financial corporations (PNFCs) – fell further in June, to just 0.1% annualised. Growth of its broad equivalent, non-financial M4, remained at 3.0%, below a 4.5% average over 2015-19, associated with beneath-target average CPI inflation – see chart 1.

Chart 1

Chart 1 showing UK Narrow / Broad Money (% 6m annualised)

Monetary warning signals are being ignored partly because official / consensus focus is on the Bank of England’s headline M4ex broad aggregate, which grew by 4.4% annualised in the six months to June – exactly in line with its 2015-19 average.

M4ex relative strength, however, reflects rapid expansion – by 14.1% annualised in the six months to June – of money holdings of “non-intermediate other financial corporations (OFCs)”, mainly attributable to increases in balances of securities dealers and fund managers. Such holdings are volatile and – unlike non-financial M1 / M4 – uncorrelated with future activity / prices*.

Six-month growth of M1 / M4 holdings of private non-financial corporations (PNFCs) fell further in June, to 1.4% / 0.4% annualised respectively. Household M4 growth firmed to 3.8% but M1 momentum moved into marginal contraction. The shift from sight deposits into time deposits and ISAs suggests weak spending intentions and a preference for saving – chart 2.

Chart 2

Chart 2 showing UK Household / Corporate Money (% 6m annualised)

A previous post argued that falls in six-month non-financial M1 / M4 growth in April / May were partly payback for upward distortions related to portfolio adjustments before the October Budget and a front-loading of housing market activity ahead of the end of the stamp duty holiday. With such effects fading, ongoing monetary weakness is stronger evidence of overrestrictive policy.

*Correlations of the two-quarter rate of change of nominal GDP with two-quarter changes in money measures, lagged two quarters, over 1998-2019: M4ex +0.19, non-financial M4 +0.41, M4 of non-intermediate OFCs -0.08, non-financial M1 +0.65.

June money numbers cast doubt on ECB President Lagarde’s assertion that policy-makers – and by extension the Eurozone economy – are “in a good place”.

Six-month growth of the preferred narrow / broad money measures here – non-financial M1 / M3, comprising holdings of households and non-financial corporations (NFCs) – fell further to 3.4% and 1.6% annualised respectively last month. The latter is the slowest since December 2023 and compares with a 4.9% average over 2015-19 – see chart 1.

Chart 1

Chart 1 showing Eurozone Narrow / Broad Money (% 6m annualised)

Weakness is focused on the corporate sector: NFC M1 / M3 deposits rose by only 0.5% and 0.1% annualised respectively in the six months to June, implying real terms contraction – chart 2.

Chart 2

Chart 2 showing Eurozone Household / Corporate Deposits (% 6m annualised)

Corporate liquidity deterioration suggests that companies are under increased financial pressure and will rein in expansion plans – chart 3. A contraction in UK real corporate money preceded recent employment cut-backs.

Chart 3

Chart 3 showing Eurozone Non-Residential Fixed Investment (% 2q) & Real Corporate Deposits (% 6m)

Six-month narrow money momentum is notably weaker in France / Italy than Germany / Spain, although German growth has fallen back since April – chart 4.

Chart 4

Chart 4 showing Non-Financial M1 Deposits* (% 6m annualised) *Own Seasonal Adjustment

Consensus commentary focuses on bank lending, which, as an empirical matter, lags money trends. Adjusted loans to households and NFCs rose by a solid 0.4% on the month but six-month growth eased from 3.0% to 2.8% annualised. The “credit impulse”, in other words, may be rolling over.

Recent rate cuts are feeding through and it is possible that monetary weakness will prove temporary. Still, ECB officials should be concerned by the slowdown and signalling an openness to further easing rather than projecting complacency.

Our 2024 Responsible Investment report reflects our commitment to sustainable infrastructure investments and reports on the initiatives we’ve taken across our portfolio over the past year.

Report highlights:

  • Long-term investors: As an employee-owned business, we invest directly alongside our clients – aligning our success with theirs. This shared commitment drives our focus on building and maintaining a resilient, high-performing portfolio that delivers long-term value.
  • Sustainable practices: Given the long-term nature of our investments, we recognize that operating responsibly is essential to protecting and enhancing asset value. We identify, assess, price, manage and monitor material responsible investment-related risks and opportunities throughout the investment lifecycle.
  • Impactful projects: Our investments provide essential services across a diverse asset base of critical transportation, social and renewable energy infrastructure, including over 2 GW of operating capacity through a range of clean energy sources including wind, hydro and solar.
  • Community engagement: We actively work with like-minded partners and stakeholders, including local communities and Indigenous groups to align interests, foster mutual understanding and ensure that those impacted by our projects are meaningfully engaged throughout the asset lifecycle.

Korean temple in front of N Seoul Tower at Namsan Mountain Park.

South Korean equities have been on a rollercoaster over the past few years. In early 2024, we saw exuberance fuelled by the announcement of the Corporate Value-Up program. Many were hoping the country was shaping up to follow in the footsteps of Japan – Super-cheap Korean equities rally on market reform talks

Hopes were shattered by disgraced former president Yoon’s attempt to impose martial law in December – South Korea rocked by president’s attempt to impose martial law

While the situation was precarious, South Korean institutions held firm and Yoon now sits in a Seoul detention centre awaiting trial while Democratic Party leader Lee Jae-Myung decisively won a June snap election on a platform of corporate governance reforms.

South Korean equities rally

Korean equities surged around the election, led by financials and technology stocks. We gradually lifted our underweight exposure to neutral and then a modest overweight through the first half of 2025, leaning into the promise of revisions to the Commercial Law Act and Lee’s support of the Value-Up program.

Line graph showing MSCI Price Indices January to June 2025

Source: LSEG Datastream

In our view, a series of policy initiatives pushed by the Lee administration have the potential to lift a host of beaten-down domestically focused names, outlined below.

Supporter of Value-Up

Despite being launched by Lee’s then opposition, his party is a supporter of Value-Up. The initiative, modelled on the Tokyo Stock Exchange reforms aims to narrow the “Korea Discount” by enhancing corporate governance, capital efficiency, and shareholder returns.

By publishing Value-Up plans and following through, Korean companies can access Korean Exchange fee exemptions, gain priority in investor relations events, and other awards to enhance market visibility. Taking these steps will also help to better align South Korean governance standards with global best practice, and in turn attract foreign capital and boost valuations.

Commercial Act revision

The Lee government quicky jumped into action to push through revisions to the Commercial Act, which align with the aims of Value-Up. In early July a revised version of the Commercial Act amendment was passed with support from both the Democratic Party and the conservative opposition as a compromise. This version:

  1. mandates that directors balance corporate and shareholder interests;
  2. requires electronic shareholder meetings for large listed companies (market cap over 2 trillion won, ~$1.5 billion); and
  3. prohibits rejecting cumulative voting requests to empower minority shareholders.

The Cabinet approved these amendments on July 15, 2025, signalling their imminent implementation.

Encouraging more equity investment and less speculative investment in housing

The government is also intent on pushing for a shift in the balance of household wealth (approximately 70% of household assets) from real estate to equities. President Lee’s aim is to channel liquidity away from housing speculation to promote greater stability in the Korean economy, and redirect capital into equities. The idea is that this will fuel investment in more productive sectors such as technology and defence in order to stimulate innovation and economic growth.

Value-Up and revisions to the Commercial Act are key levers to encourage this shift by households into domestic stocks.

Excess liquidity provides fuel for stock market rallies
Chart showing Korea M2 growth year over year versus Kospi return year over year from 2001-2024.
Source: CLSA

Fiscal loosening

The government is also taking direct action to counter stagnant economic growth. In June the government proposed a KRW30.5 trillion supplementary budget, representing 0.9% of GDP, with KRW10 trillion to be handed out as cash for consumption (equivalent to around USD100-350 per person depending on income).

Portfolio – financials exposure boosted

Our portfolio names in financials and technology in South Korea have rallied this year on hopes for President Lee Jae-Myung’s reform platform. Our position in Samsung Life is a beneficiary of the Value-Up program, and rose 67.7% in USD terms through the second quarter alone on expectations reforms will force the disposal of company holdings in affiliated companies. Samsung Life selling its position in Samsung Electronics would trigger a huge one-off gain which will free up cash to be re-deployed into more productive uses and boost returns on equity. We trimmed Samsung Life to rotate into laggard DB Insurance, which is cheaper and in our view, has greater upside catalysts, being yet to announce Value-Up plans.

Leading bank KB Financial was another strong performer, reporting robust profit growth along with a surprise share buyback and cancellation as well as a higher dividend. The bank trades on a modest 0.7x price to book with a return on equity of 9.7% and rising, as well as a 4% dividend yield.

KB Financial driving ROE higher
Chart showing KB Financial's ROA, ROE and ROE excluding non-recurring items from 2020 to Q1 2025.
Source: KB Financial Q1 2025

… while buybacks continue
Bar graph showing KB Financial's common shares outstanding from 2020 to March 2025.
Source: KB Financial Q1 2025

… and dividends increase
Bar graph showing KB Financial's dividends per share from 2020 to Q1 2025.
Source: KB Financial Q1 2025

KB also looks set to benefit from planned fiscal loosening by the Lee government and falling central bank rates boosting loan growth.

More to come?

Shareholder and political pressure on South Korean corporates to address their poor corporate governance records continues to build. Progress will no doubt be slow and incremental, but there is a lot of low hanging fruit the government can pursue including changes to capital, dividend and capital gains taxes to encourage investment and reform simultaneously.

Success in these efforts could well be the basis for a full market re-rating.

EM equities outperformed DM on average historically under two conditions, namely 1) global (i.e. G7 plus E7) six-month real narrow money growth was above industrial output growth and 2) real money growth was stronger in the E7 than G7. The first condition indicates a supportive global liquidity backdrop while the second signals stronger economic prospects for EM than DM.

Allowing for data reporting lags, these conditions were satisfied from end-February through end-June, a period during which MSCI EM outperformed MSCI World by 5.8%. However, the latest numbers, for May, show global six-month real money growth slipping back below industrial output momentum, although the E7 / G7 gap remains positive – see chart 1.

Chart 1

Chart 1 showing G7 + E7 Industrial Output & Real Narrow Money (% 6m)

The suspension of the positive signal may prove temporary. Global industrial output has been boosted by front-loading to avoid higher US tariff rates, with payback likely during H2.

Chart 2 shows six-month real narrow money momentum in major EM economies and includes June data for Brazil, China and India. The stand-out recent development has been a pick-up in India in response to aggressive RBI easing, suggesting acceleration in an already strong economy.

Chart 2

Chart 2 showing Real Narrow Money (% 6m)

Chinese six-month momentum stabilised in June after falling in April / May. The series shown is based on the new official M1 measure, which includes household demand deposits and is close to the “true M1” definition historically used here. The June stabilisation followed a cut in reserve requirements in May and an associated further decline in money rates.

The Chinese slowdown since March is regarded here as of limited concern and likely to reverse, for the following reasons. First, there has been no loss of momentum in “private non-financial M1”, comprising currency and demand deposits of households and non-financial enterprises – chart 3. The aggregate slowdown appears to be attributable a fall in money holdings of government-related organisations and / or non-bank financial institutions.

Chart 3

Chart 3 showing China Narrow Money (% 6m)

Secondly, M1 excludes fiscal deposits, which have been growing solidly ahead of likely spending and / or transfers to government-related bodies. Momentum of an expanded aggregate including such deposits fell by less in April / May, recovering slightly in June.

Elsewhere. Taiwanese growth firmed in May and may rise further as currency strength forces the central bank to ease. By contrast, momentum has slowed in Indonesia, Korea and Mexico and remains negative in Brazil.

Windmill turbines on a sunny day in Germany on a blooming bright yellow field and blue sky.

In our last commentary, we discussed Germany’s recent infrastructure bill worth EUR500 billion to be deployed over twelve years. A key component of this bill is climate-led investments, worth one-fifth of the total budget, which finances the energy transition and climate protection measures. Examples of these measures include energy-efficient building renovations, development of electric mobility infrastructure, expansion of the hydrogen industry, promotion of energy efficiency, technologies to decarbonize industrial operations, etc.

Many countries have implemented clean energy plans to mitigate climate risk. Norway generates almost 100% of its electricity from renewable sources, primarily hydropower. Other leaders in renewable energy adoption include Sweden, Costa Rica, the UK, Iceland, New Zealand and Germany, etc.

A lesser known, but much bigger investment plan, is Japan’s Green Transformation (GX) policy worth JPY150 trillion (over USD1.1 trillion) to be executed over ten years. It was announced in February 2023 with many detailed targets across energy, transport, construction, industry and finance. Its goal is to achieve carbon neutrality by 2050 and transform the country’s economy toward clean energy.

In our Sustainable Global Small Cap Strategy, clean energy and sustainable infrastructure are among the major themes. We have witnessed the strong growth of some holdings benefiting from these mega trends. Below are a few examples:

  • Boralex Inc. (BLX CN) develops, builds and operates renewable energy power facilities (wind, hydroelectric, solar and thermal). It owns and operates about 100 wind power stations, 15 hydroelectric plants, a dozen solar power stations and two energy storage facilities. Its combined installed capacity has more than doubled in the past five years to over 3.1 GW, with 8 GW in the pipeline. Major markets are Canada, France, the United States and the UK.
  • Aecon Group Inc. (ARE CN) is a Canadian construction company, providing a range of services to private and public sector clients in infrastructure, mostly in North America. In 2024, 59% of its revenues and 78% of backlog were tied to sustainability projects from renewable energy (hydroelectric, geothermal, solar) to energy transition (nuclear, battery storage, energy transmission and grid modernization) and water management (supply, distribution and wastewater treatment). As of March 31, 2025, it had a record-high backlog of CAD9.7 billion.
  • Nexans SA (NEX FP) is a global leader in cable systems and services. It is strategically focusing on the electrification market. 75% of sales generated from products and services contribute to energy transition and efficiency. Well-known for its high-voltage transmission cable and subsea cable, Nexans specializes in power generation, transmission, distribution, infrastructure, telecommunication, mobility services and more. As of March 31, 2025, it had a record-high backlog of EUR8.1billion. Major markets are Norway, France, Germany and Canada.

Within the theme of sustainability is the growing industry of green hydrogen. The global green hydrogen market size is currently estimated at over USD12 billion in 2025 and is expected to expand at a CAGR of 41% from 2025 to 2034.

Projected growth of green hydrogen market size from 2024 to 2034.

There are national policies in place that favour green hydrogen: Germany’s hydrogen strategy targets at least 10 GW production of green hydrogen by 2030; the UK’s hydrogen strategy requires at least half of its 10 GW target to come from green hydrogen by 2030; Japan’s hydrogen strategy focuses on achieving carbon neutrality by 2050 through the widespread adoption of hydrogen across various sectors.

There are three main types of electrolysis used for green hydrogen production: Proton Exchange Membrane (PEM), Alkaline and Solid Oxide. Advantages of PEM electrolysis specifically are that it uses a solid polymer electrolyte membrane and operates at higher current densities, making it suitable for dynamic and intermittent renewable energy sources. Major players in the PEM segment include Plug Power, Nel Hydrogen, Cummins and, one of our holdings, ITM Power PLC (ITM LN).

ITM Power is a pure-play in green hydrogen and manufactures electrolyzers based on PEM technology; it’s known for its work with Linde on large-scale PEM electrolyzers. Germany is its biggest market generating 37% of total sales, followed by the UK, Austria, Australia and rest of Europe.

Countries prioritizing initiatives for renewable energy, sustainable infrastructure and electrification will look to work with companies specializing in these sectors. We feel that the holdings within our Sustainable Global Small Cap Strategy are well positioned to benefit from this global effort toward a greener future.