Money Moves Markets
When will the Fed start cutting rates?
November 17, 2022 by Simon Ward
A simple model of the Fed’s past behaviour suggests a shift in policy direction from tightening to easing in March 2023, assuming that the economy evolves in line with its forecasts.
The Fed could delay cutting rates for several months but the model suggests a strong likelihood of action by Q3.
The model is based on the following observations / judgements about the Fed’s historical behaviour:
- Policy direction alternates between tightening and easing and is rarely “on hold” for long.
- Fed officials aren’t guided by a “target” level of rates; rather, they continue to tighten or ease until incoming data prompt them to stop / reverse.
- The Fed places little weight on forecasts, focusing instead on recent trends in variables related to its mandate objectives.
The aim of the model is to estimate the probability that the Fed will tighten or ease in a particular month based on data available at the time of the decision. It does not attempt to predict the size of any move (although extreme probability readings suggest larger moves).
The model assesses the relative probability of tightening versus easing – “on hold” is excluded by design. As noted, periods of stable policy have been infrequent and usually short-lived historically. (The long period of Fed funds stability in the 2010s is misleading because the Fed was easing / tightening via QE and other “unconventional” policies during this period, as reflected in movements in “shadow” rates.)
To estimate the model, history was divided into alternating unbroken episodes of tightening and easing. This division was made judgementally based on the timing of peaks and troughs in official or shadow rates. Shaded areas in the chart below denote tightening episodes.
A decision was made to limit the model inputs to a small number of “obvious” variables, rather than cherry pick from a large data set to achieve maximum fit. The model, nevertheless, performs adequately, with the probability estimates consistent with policy direction in 88% of months (i.e. above 50% in tightening months and below 50% in easing months).
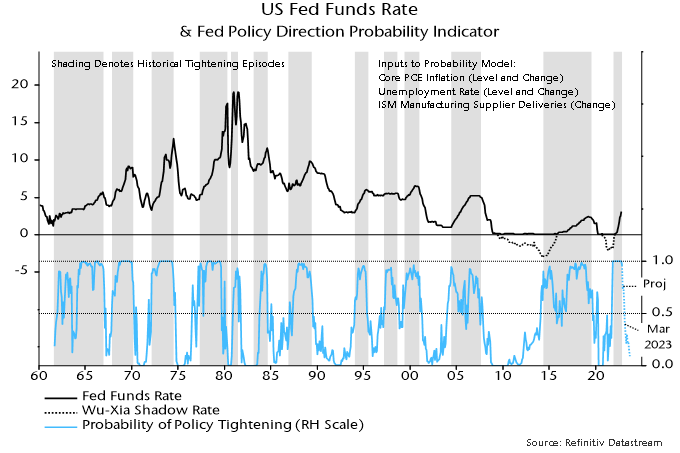
The key inputs are the levels and rates of change of core PCE inflation and the unemployment rate. The rate of change of the ISM manufacturing supplier deliveries index – an indicator of production bottlenecks – was also found to be significant.
The model assessment was that there was a 96% probability of tightening in November. This estimate incorporated a September number for core PCE inflation and October readings for the unemployment rate and ISM supplier deliveries.
The median forecast of FOMC participants in September was for core PCE inflation to average 3.1% in Q4 2023, versus 5.1% in September 2022. The unemployment rate was forecast at 4.4% in Q4 2023 versus 3.7% in October 2022. The probability projections in the chart assume straight-line movements in the two variables from their latest levels to the Q4 2023 forecasts. Additionally, the ISM supplier deliveries index is assumed to be stable at its October 2022 level.
The forecast probability of tightening falls to 74% in December, suggestive of a smaller rate hike of 50 or even 25 bp next month.
The first FOMC meeting in 2023 is on 31 January-1 February. The forecast tightening probability is little changed from its December level in January but falls further in February and moves below 50% in March – the 40% reading implies a 60% likelihood that the Fed will by then have shifted to an easing bias.
The implied easing probability increases further after March, exceeding 90% in September, suggesting a strong likelihood that the Fed will be cutting rates by then.
Alternative assumptions can be examined. If the unemployment rate were to rise to 4.4% in Q2 rather than Q4, the easing probability would reach 90% three months earlier, in June.
An unlikely worst case scenario is that core inflation and the unemployment rate remain at current levels. Interestingly, even in this scenario the tightening probability falls below 50% in April, fluctuating around the 50% level over the remainder of the year. (This reflects a downward pull from the rate of change terms, which offsets continued upward pressure from levels of core inflation and unemployment.)