Money Moves Markets
US / UK core prices slowing on “monetarist” schedule
February 16, 2023 by Simon Ward
US and UK CPI data this week elicited opposite market reactions but core momentum has recently slowed notably in both cases, consistent with a moderation in money growth rates two years earlier.
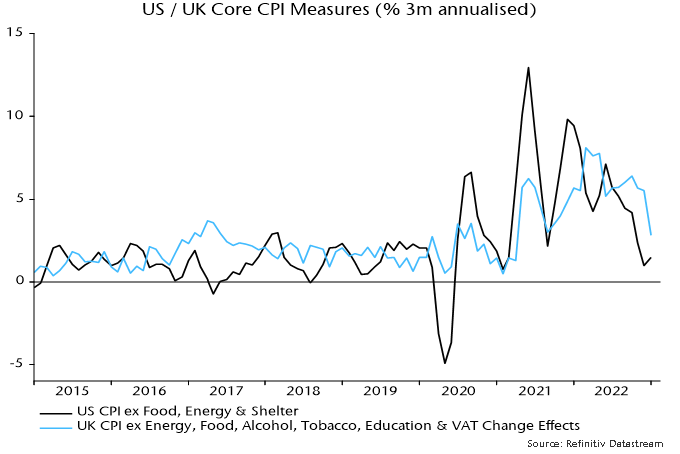
Chart 1 shows three-month annualised rates of change of preferred core measures – CPI ex. food, energy and shelter for the US and CPI ex. energy, food, alcohol, tobacco, education and VAT change effects for the UK. US three-month momentum was just 1.5% in January, while UK momentum fell sharply to 2.8%.
Chart 1
The ”monetarist” rule of thumb is that money leads prices by about two years. Chart 2 superimposes three-month rates of change of broad money. Growth peaked in May 2020. The recent significant declines in core CPI momentum began in June 2022 in the UK and July in the US.
Chart 2
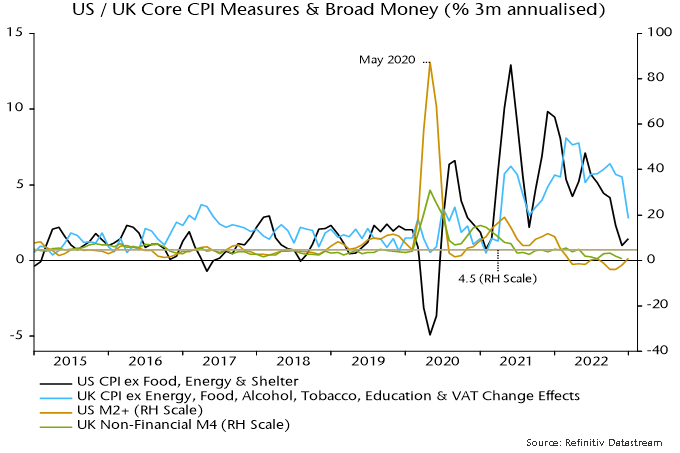
Average broad money growth of 4.5% pa in both the US and UK over 2010-19 was associated with sub-2% average core CPI inflation. Three-month rates of change of broad money moved below 4.5% annualised on a sustained basis in March 2022 in the US and June in the UK. A reasonable expectation, therefore, is that core CPIs will be rising at a sub-2% by mid-2024 in both cases.
The path lower in money growth from the May 2020 peak was bumpy and core CPI momentum is likely to display similar volatility around a declining trend.