Commentary
Things are looking up
March 2, 2023
Europe’s economic outlook has seen a clear improvement in less than three months. The risk of a gas shortage in Germany has disappeared at least for 2023. Thanks to a decrease in energy usage and some industrial delocalization outside Germany, Europe’s energy consumption has decreased by 19% since last summer. According to the ZEW – Leibniz Centre for European Economic Research, economic sentiment indicators rose to 28.1 for a fifth consecutive month, 11.2 points above the level of the previous month. Service PMIs reading also beat all expectations and posted decent growth in both continental Europe and the UK.
As demand stays firm and China reopens, there will be growing pressure on central banks to hike rates further to contain demand. Inflation has just started to cool off in Europe, but levels are still elevated. Consequently, interest rates could stay higher than expected for some time.
Here are some observations following some earnings results that came out for Q4 (2022):
- Q4 earnings and top-line growth declined sequentially but held up well, given the still solid demand and pricing.
- Companies expressed more optimism for the global economy but were incrementally more cautious on margins levels, foreign exchange tailwinds and demand for 2023.
- A lower proportion of companies mentioned having enough pricing power to pass on inflation in the short term.
- Labour cost component is becoming the primary source of concern on the cost side, as supply chain and energy costs have come down considerably.
We believe that the old continent prospects look better than they appear. Some of the highlights and attractiveness of European companies include:
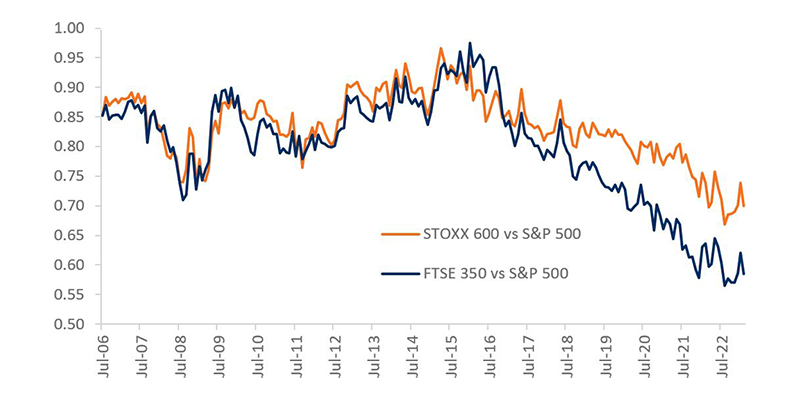
Forward price-to-earnings ratio
Forward price-to-earnings ratios for European companies have been attractive relative to the S&P 500. The discount has been even stronger for the UK FTSE 350 Index as shown below.
STOXX 600 and FTSE 350 12-month P/E forward relative to S&P 500
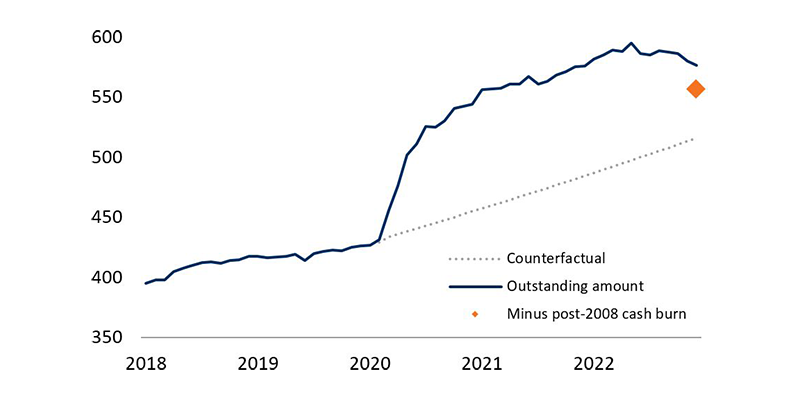
Cash positions
Cash piles have been quite considerable since the global financial crisis, and especially in the UK post-Brexit. Geopolitics and macroeconomics have pushed UK companies to increase their cash positions to more than £576 billion at the end of 2022. We believe that once confidence returns, capital spending should resume.
Deposit of UK non-financial institutions (£bn)
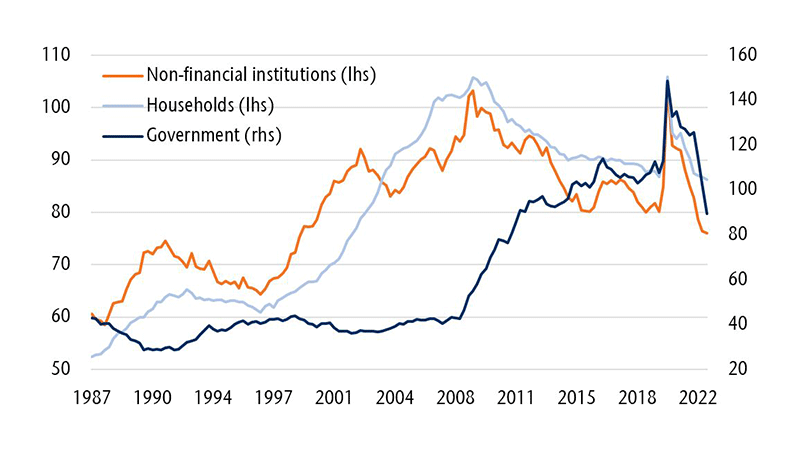
Debt levels
Balance sheets have improved across all segments in both the UK and continental Europe. Thanks to stronger GDP levels driven by inflation, debt levels as a percentage of GDP decreased to levels last seen in 2009. Corporate debt levels even returned to 2007 levels.
Outstanding debt in % of GDP