Commentary
Navigating booms and busts in China
April 13, 2023

Summary
- Emerging market equities notched a positive month despite the fears over cracks appearing in developed market banking systems with the failure of Signature Bank, Silicon Valley Bank and the UBS takeover of Credit Suisse.
- Chinese equities steadied in March, slightly up as the two sessions (China’s equivalent of parliament) rubber stamped Xi’s unprecedented third term as leader, and Li Qiang’s ascent to the role of Premier. Li was keen to tout China’s business-friendly credentials in his first remarks as premier.
- This was followed later in the month by Jack Ma’s return to Hangzhou, China, the home of Alibaba HQ. This was followed shortly after by an announcement by the company that it would be split into six units. According to Alibaba CEO Daniel Zhang, the units will be able to “pursue independent fundraising and IPOs when they are ready.”
- This provided a major boost to large cap Chinese tech stocks, with investors interpreting the announcement as further confirmation that regulatory headwinds for the sector were easing.
- Portfolio names Alibaba, Tencent and Netease all rallied sharply.
- Stocks in Taiwan and South Korea were stronger, in part due to some optimism that the deep downcycle across the semiconductor industry is starting to bottom.
- Brazil underperformed wider emerging markets. Despite falling inflation and scope for the central bank to consider rate cuts, political risks continue to curb investor enthusiasm. President Lula’s scepticism of central bank independence and a free spending fiscal agenda are key concerns which muddle a potentially compelling opportunity for investors.
- Gulf markets were weak, as headwinds build for energy prices and other commodities given the deteriorating global economic outlook.
Navigating booms and busts in China
Given the wide dispersion of country returns in emerging market equities each year, we know that outperformance hinges on finding the right stock in the right country. As the below chart illustrates, great stock fundamentals can be wiped out by poor macro.
Dispersion of EM country returns
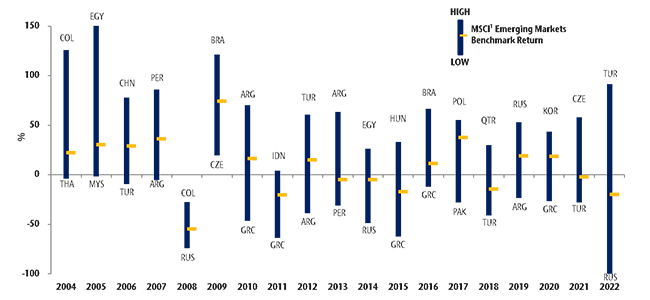
The opportunity to gain exposure to high-quality companies operating in an economy delivering structural outperformance – such as India at present – is a key attraction of emerging market equities. However, experience teaches us that it is through avoiding big negative macro shocks in EM that we can sustainably tilt the odds in our favour.
Our approach to country analysis centres on two elements: 1) hard data inputs with monetary aggregates at the heart of this; and 2) qualitative macro analysis incorporating an assessment of shorter-term factors such as political risk and longer-term structural factors like institutional quality.
This piece will focus on the quantitative element, and specifically the role that the Liquidity Theory of Asset Prices plays in country selection.
Emerging markets and the Liquidity Theory of Asset Prices
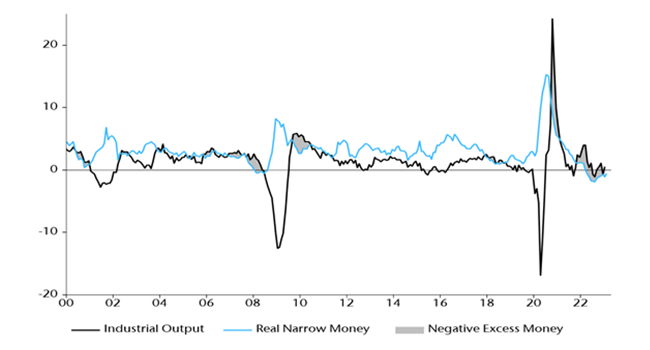
Analysis of monetary (or liquidity) data is a key input in our process for determining country weightings. This is based on the insight that, while we know that monetary trends lead the economy, “excess” money – the difference between the growth of real money supply and industrial output – moves markets even earlier. Broadly speaking, when narrow money is growing above industrial production, you are probably in a bull market somewhere as money not put to use in the real economy finds its way into bonds, stocks, property and other assets. The reverse also applies, with current weakness in financial markets reflecting a deteriorating liquidity picture as hot inflation and tight monetary policy suck money out of markets.
G7 + E7 industrial output & real narrow money (% 6m)
Applying Liquidity Theory in EM equities
We have found this to be a powerful leading indicator and tool for assessing the optimal country exposure through economic and market cycles. In emerging markets this works particularly well as we analyse liquidity country by country in a wide and diverse opportunity set.
Over the decades our team has compiled data on the sensitivity of individual countries in EM to varying liquidity environments. This helps us gauge whether the tide is coming out or in for a country’s financial markets. While this data provides signals for which markets might be winners over the medium term, we find that it adds the most value in providing warning signs of vulnerabilities that precipitate market shocks. You do not want to be around in a country like Argentina or Turkey when the liquidity tap shuts off.
Key input for managing China exposure
Liquidity analysis has been central to managing our portfolio exposure in China. As the chart illustrates below, observing the change in real narrow money growth is a key input for anticipating periods of out- or underperformance for the largest component of the EM benchmark. This is married up with qualitative macroeconomic research and in-depth economic value added stock analysis to determine exposure that aligns with our level of conviction.
MSCI China price index relative to MSCI EM & NS Partners’ active weight in China + Hong Kong
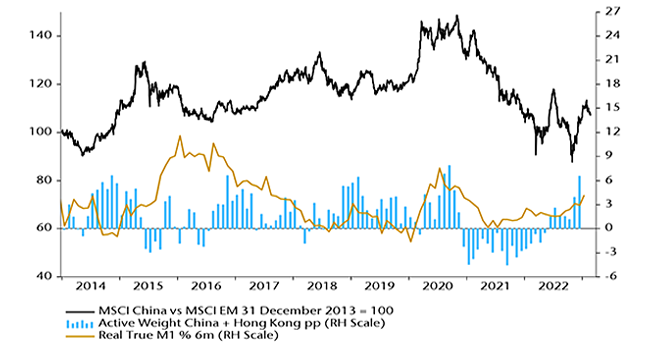
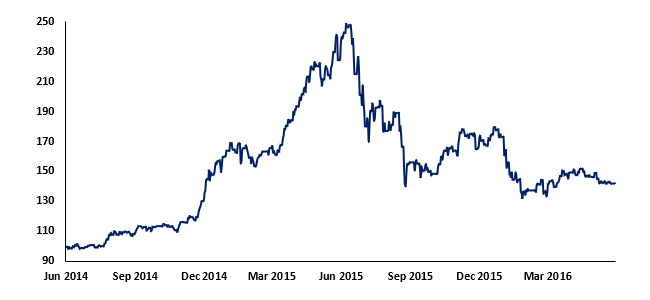
Successfully navigating the violent boom and bust of Chinese equities from 2014 through to mid-2016 demonstrates the effectiveness of this approach. Improving narrow money through the beginning of 2014 preceded a lift in exposure to China as the market began to outperform. Conversely, money numbers deteriorated from mid-2014, a warning sign that the rally was on borrowed time. This formed part of our decision to begin cutting exposure ahead of the market peak in June 2015. Highly leveraged retail investors had fuelled the final euphoric stages of the rally. News of a softening economy saw sentiment for Chinese equities wane, with initial modest stock declines triggering a wave of margin calls that precipitated a frenzied sell-off.
CSI 300 index (rebased to 100)
Fearing the slump would trigger a major financial crisis, Chinese authorities stepped in to introduce short selling bans and stock “circuit breakers”, while loosening margin requirements to allay fears of further defaults. Lock-up periods were enforced for owners of more than 5% of a company’s tradeable stock, and mutual funds and pension funds were compelled to support the market. Critically, the PBoC stepped in to slash rates, providing a significant boost to money numbers. Sentiment remained fragile through the beginning of 2016 with investors concerned about the ability of Beijing to rebalance a structurally slowing economy with bad debts without triggering capital flight. We were more constructive than consensus and gradually lifted exposure to overweight, encouraged by money numbers signalling a stronger economy ahead and judging that authorities had the tools to keep forex and balance of payments risks in check.
More recently, having been significantly underweight through the brutal selloff in Chinese equities in 2021, we began lifting exposure at the end of that year in response to improving liquidity data, reaching a neutral weight by the middle of 2022. This was subsequently raised to overweight later in the year as money numbers improved further, some political headwinds eased and Beijing’s COVID-zero approach to the pandemic was rapidly abandoned. The weighting shift provided a boost to portfolio performance as Chinese equities rallied hard on the “reopening trade”.
CSI 300 & HSI index (rebased to 100)
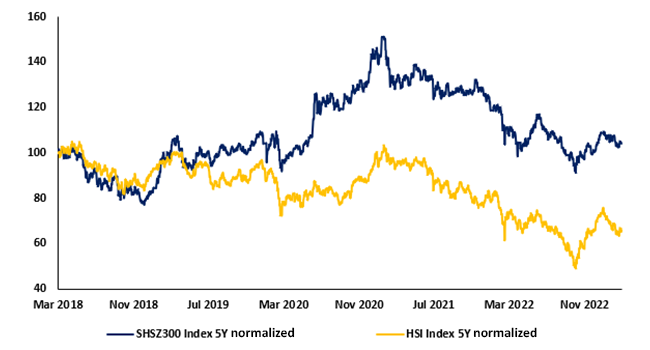
Looking ahead, we remain modestly bullish on Chinese equities but believe that current monetary trends signal that the authorities are determined to avoid overstimulating and sparking a Western-style inflation surge, which would risk social disruption. This should support a gradual but more sustainable economic recovery favouring quality names, as opposed to more cyclical parts of the market and derivative plays in materials and energy.
As outlined above, in addition to quantitative inputs to our process, we also consider shorter term political risks along with longer term measures of institutional quality. China faces major challenges on both of these fronts as the Sino-U.S. dispute intensifies and as Xi Jinping consolidates power at the expense of the intra-party pluralism established under Deng Xiaoping. It means that while a monetary and economic recovery provides a supportive backdrop, our qualitative assessment of political and policy risks limits our conviction and consequent portfolio exposure to China.