Money Moves Markets
Monetary relief for bonds?
May 4, 2022 by Simon Ward
Global six-month real narrow money growth fell to zero in March*, the weakest since the GFC and a level historically consistent with recession – see chart 1. (The current reading matches a low before the 2001 recession.)
Chart 1
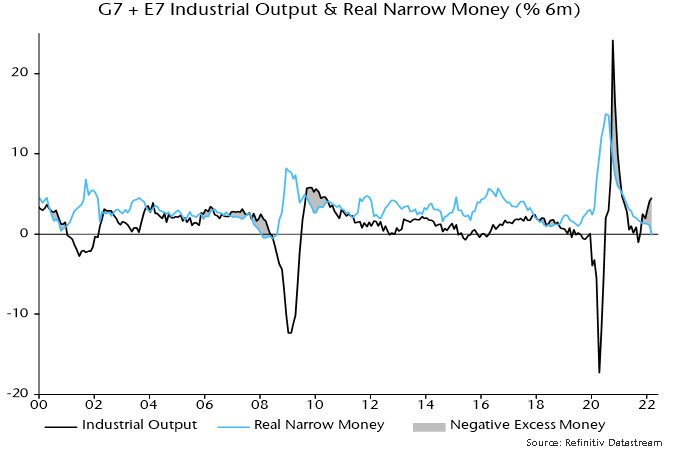
A rebound in six-month industrial output growth, meanwhile, extended in March, reflecting a production catch-up from weakness in H2 2021 due to supply-side constraints. The negative real money / output growth gap, therefore, widened further.
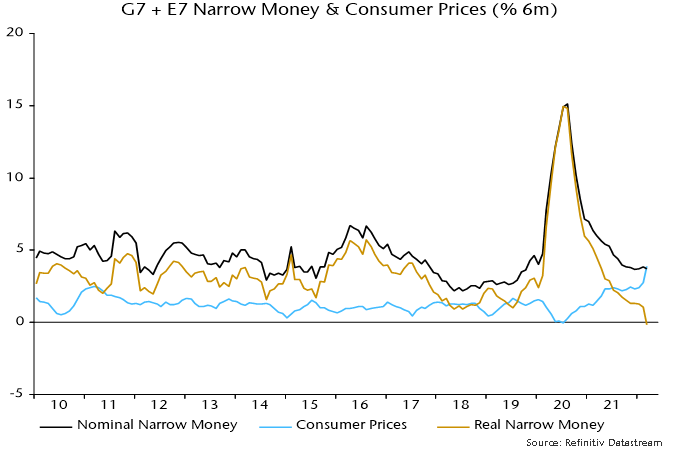
The March fall in real money growth was driven by a further spike higher in six-month consumer price momentum. Nominal money growth was little changed – chart 2.
Chart 2
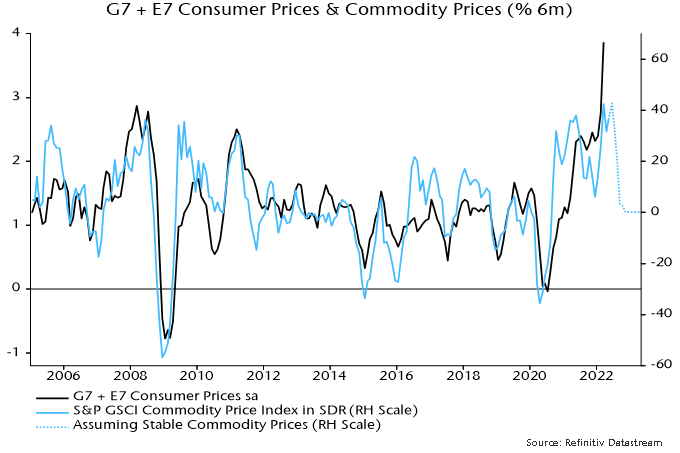
The historical relationship with commodity prices suggests that CPI momentum has overshot and will pull back, possibly sharply – chart 3.
Chart 3

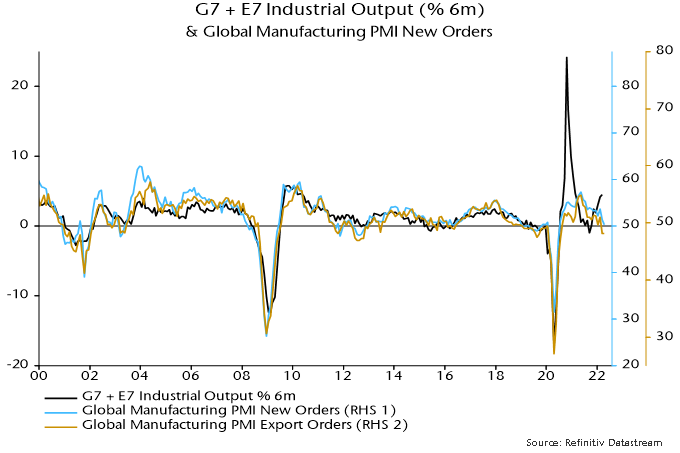
 Six-month industrial output momentum, meanwhile, may move back into contraction because of Chinese covid disruption and weakening trends elsewhere, reflected in soft April global manufacturing PMI results – chart 4.
Chart 4
Nominal money growth will probably weaken in response to rising rates and as central banks end / reverse QE but falls in CPI and industrial output momentum may dominate, resulting in a narrowing of the negative real money / output growth gap. The gap, indeed, could return to positive territory by mid-year – sooner than previously expected here.
This gap is a proxy measure of global “excess” money, which – on the monetarist view – is a key driver of demand for financial and real assets**.
Historically (i.e. from 1970-2021), global equities underperformed US dollar cash by 6.7% pa on average when the gap was negative, outperforming by 12.2% pa when it was positive. These numbers refer to month-ahead returns based on the most recent reading of the gap.
Equities underperformed cash on average when the gap was negative whether or not it was widening or narrowing. The average loss, indeed, was larger when the gap was narrowing. So the near-term message for equities remains unfavourable.
It is, however, a different story for bonds. Historically, Treasury returns have been sensitive not to the level of the gap but rather its rate of change. That is, a positive change in the gap has been associated, on average, with a fall in Treasury yields (and a negative change with a rise) – chart 5.
Chart 5
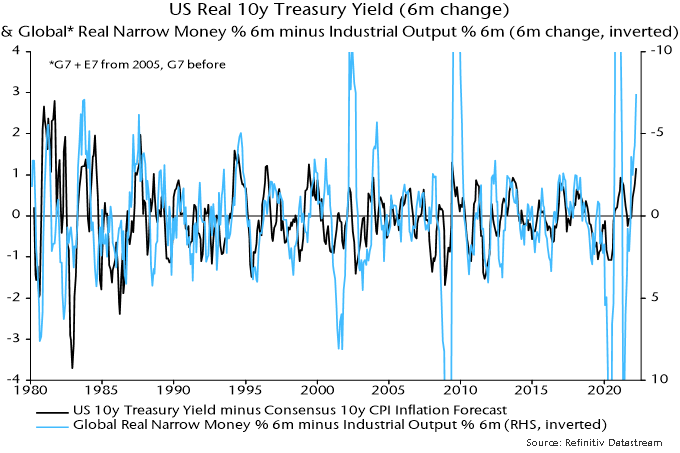
This year’s yield surge is “explained” by the move in the gap into deep negative territory.
Historically, the average fall in yields associated with a positive change in the gap was similar for positive and negative levels of the gap.
The prospective change of direction of the gap, therefore, suggests that the bond bear market is ending.
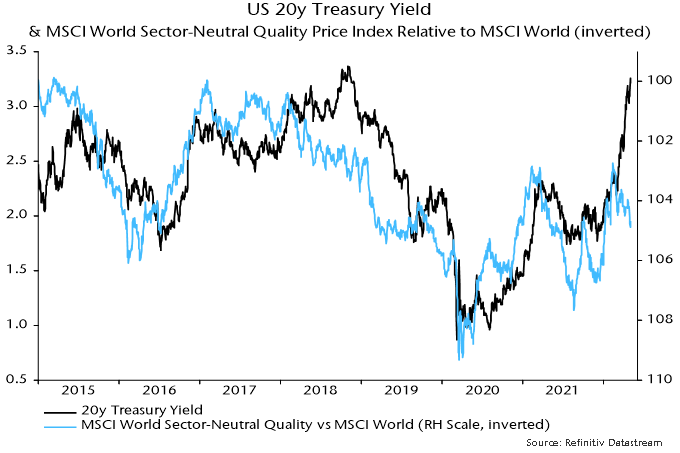
A reversal in yields would have implications for equity sectors / styles. Quality historically outperformed when excess money was negative but suffered this year from its correlation with yields – the magnitude of the yield rise may have weakened its usual defensive character. (Overweight consensus positioning may also have contributed to underperformance, i.e. quality had become momentum). A yield decline could allow a performance catch-up.
The MSCI World sector-neutral quality index has already reversed more than half of its earlier YTD underperformance despite further bond market weakness, with this recovery another indication that a yield top may be imminent – chart 6.
Chart 6
*G7 plus E7 aggregate. March estimate based on monetary data for all countries except Canada, Brazil and Korea (extrapolated).
**An additional proxy measure monitored here is the deviation of 12-month real narrow money growth from a long-term moving average. Historically, global equities outperformed cash on average only when both measures were positive. This second measure is expected to remain negative until late 2022, at least.