Money Moves Markets
G7 money trends promising 2023-24 inflation relief
April 22, 2022 by Simon Ward
March CPI numbers globally have mostly surprised on the upside (again) but monetary trends and other considerations continue to suggest significant relief in 2023-24.
G7 annual CPI inflation rose to 6.8%* in March, the fastest since 1982.
A post in September 2020 presented a “monetarist” forecast that G7 inflation would average 4-5% pa in 2021-22, i.e. between Q4 2020 and Q4 2022. Money growth in H2 2020 / 2021 was faster than assumed in the post and an outturn in the 5-5.5% range is now likely. (Annual CPI inflation was 4.9% in Q4 2021 and a retreat from the current level is likely over the remainder of 2022, partly reflecting commodity price base effects.)
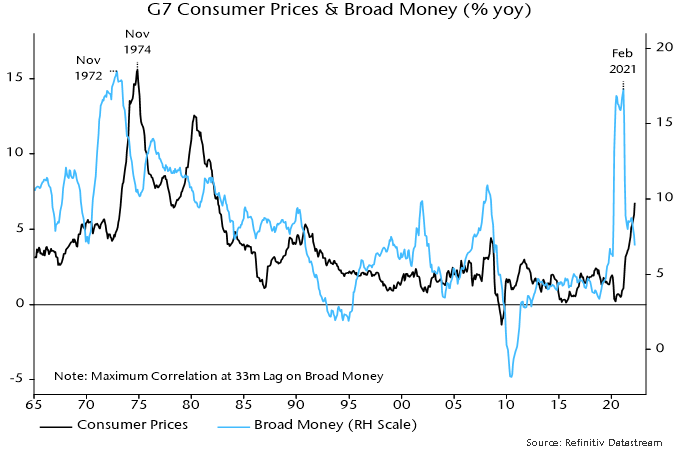
The current inflation surge reflects a money growth surge in 2020 – G7 annual broad money growth* rose from 6.2% in February 2020 to 16.9% by June, eventually peaking at 17.3% in February 2021. This increase has now almost fully reversed, with annual growth estimated to have fallen below 7% in March – see chart 1.
Chart 1
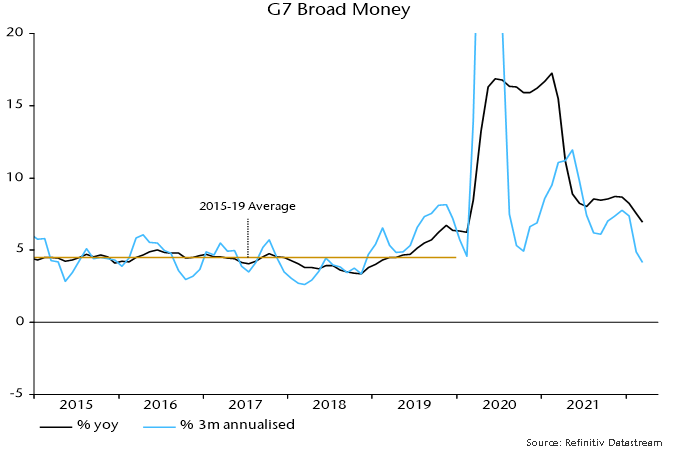
Three-month annualised growth is down to about 4%, close to its average in the five years before the pandemic – chart 2.
Chart 2
Broad money growth has slowed by much more than after a comparable surge in the early 1970s. Annual money growth then bottomed above 10% before rebounding strongly, resulting in inflation remaining high and reaching a second peak in 1980.
Sustained broad money expansion of 4% would be consistent with inflation rates returning to target, though possibly not until 2024.
Will money growth stage a 1970s-style rebound? As previously discussed, this was triggered by monetary policy-makers abandoning restraint as economies weakened. Central bankers only recently shifted hawkishly and the hurdle for a policy U-turn is high.
The broad money slowdown partly reflects the winding down of QE, suggesting further weakness if QT plans are implemented. The proposed reduction of $95 billion per month in the Fed’s securities holdings is the equivalent of 0.35% of US broad money. The actual negative impact will be smaller because of various leakages, e.g. Fed disposals are likely to be partly absorbed by an increase in holdings of commercial banks (relative to a no QT scenario), implying a neutral effect on broad money. A reasonable assumption is a “multiplier” of 0.5, i.e. a drag on US broad money of 0.175% per month, or 2.1% over a year. This would cut 1.1 pp from G7 annual broad money growth.
With central bank actions on course to exert a negative impact, a rebound in money growth depends on “endogenous” strength in bank lending to the private sector. Monetary economists continue to debate this prospect. “Bulls” note a significant lending pick-up in recent months: G7 annual loan growth, adjusted for US PPP disbursements / forgiveness, was an estimated 6% in March, faster than in any month over 2009-2019. The suspicion here is that strength partly reflects the stockbuilding cycle, which is peaking, while recent yield rises will curb housing credit demand.
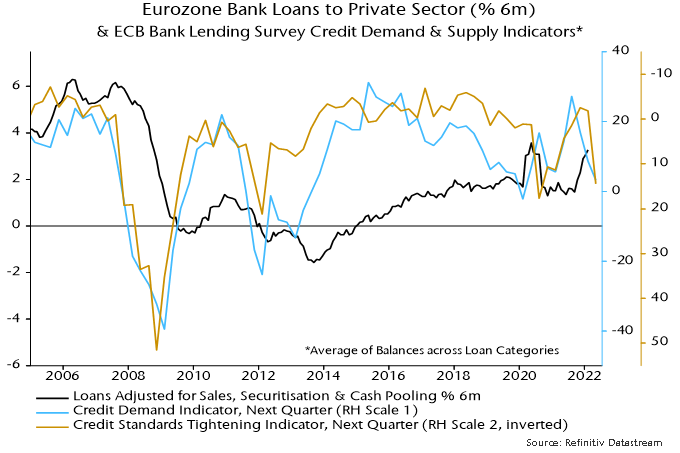
Central bank loan officer surveys are useful for gauging the outlook. The next Fed survey is due in early May but the ECB poll released last week signalled both a tightening of credit standards and weaker demand, suggesting that a recent pick-up in loan growth will reverse – chart 3.
Chart 3
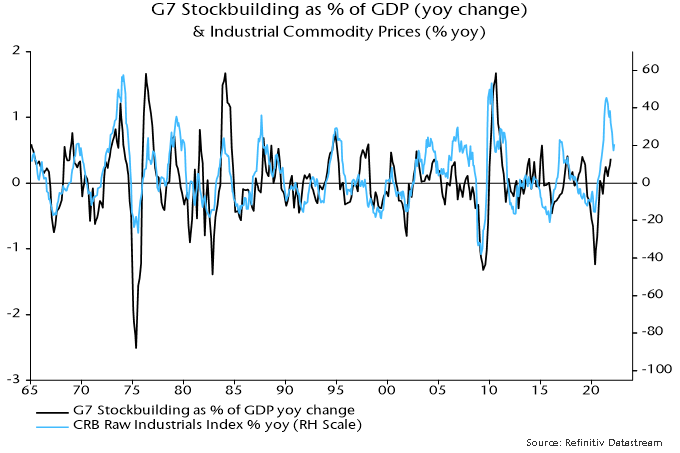
The monetary forecast of 2023-24 inflation relief is supported by the assessment that the stockbuilding cycle is about to enter a 12-18 month downswing. The cycle is correlated with industrial commodity price momentum, which appears to have peaked – chart 4. Supply issues may constrain the downside but the wedge between G7 annual headline and core (i.e. ex. food and energy) inflation – currently 2.5 pp – is likely to narrow significantly in H2 2022 and may turn negative in 2023.
Chart 4
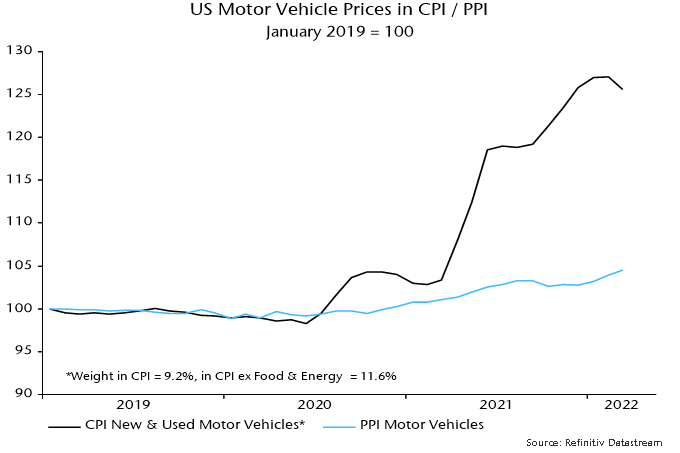
A “technical” factor promising CPI relief is a prospective reconvergence of consumer and producer prices of vehicles when supply constraints eventually ease. In the US, the CPI for motor vehicles would have to fall by 17% to eliminate a post-pandemic divergence with its PPI equivalent – chart 5. A PPI pick-up may bear part of the adjustment but the CPI vehicles index could plausibly decline by 10%, implying a 0.9% drag on headline CPI. A smaller but still meaningful effect is likely elsewhere.
Chart 5

*Own calculation using GDP weights.