Money Moves Markets
Fade the “better” economic news
June 7, 2022 by Simon Ward
Recent economic data have been interpreted as supporting the view that global growth is showing “resilience” in the face of significant shocks, in turn suggesting scope for central banks to continue to dial up hawkishness.
This reading of the data is disputed here while monetary trends continue to signal a high probability of a recession by end-2022 followed by a sharp inflation drop in 2023-24. Central bankers ratcheting up interest rate expectations are as off-beam now as they were when engaging in outsized stimulus in 2020-21.
Additional April monetary data confirm that the six-month change in global real narrow money moved deeper into negative territory and has now undershot a low reached in June 2008 as the financial crisis and associated recession escalated – see chart 1.
Chart 1
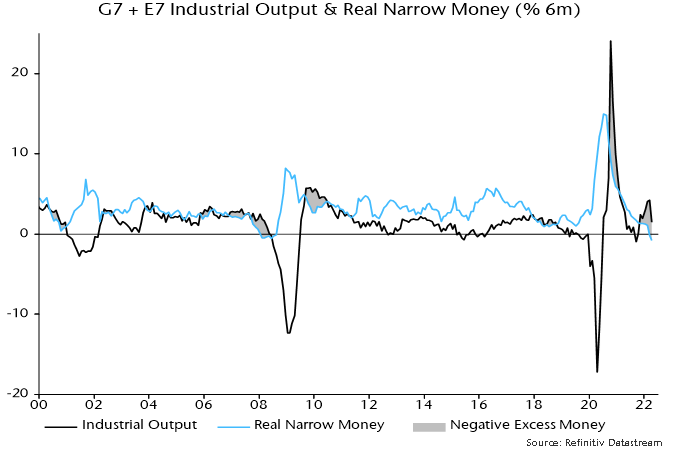
The comparison with June 2008 is relevant in other respects. The two-year Treasury yield surged from 1.35% to 3.05% between March and June as the oil price spiked above $140 and markets priced in significant Fed tightening. The next move in the Fed funds rate, then 2.0%, was an October cut, by which time the two-year was back below 1.5%.
The fall in global real money momentum in late 2021 / early 2022 reflected rising inflation. Nominal money weakness has been the driver more recently.
With Canada yet to report, three-month growth of G7 broad money is estimated to have fallen to 1.9% annualised in April – chart 2. Annual expansion is likely to have moved down to around 5% in May, close to the pre-pandemic average, based on weekly US data and a sizeable base effect.
Chart 2
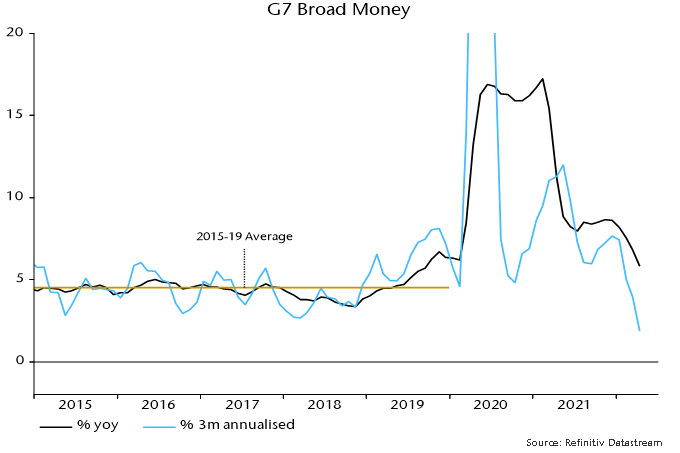
Annual broad money growth peaked in February 2021, suggesting that a fall in CPI inflation will start in 2023-24 rather than later this year, assuming a typical lead time of about two years. An “optimistic” view is that the transmission mechanism has been accelerated by supply-side shocks, implying an earlier but higher inflation peak and a faster subsequent slowdown.
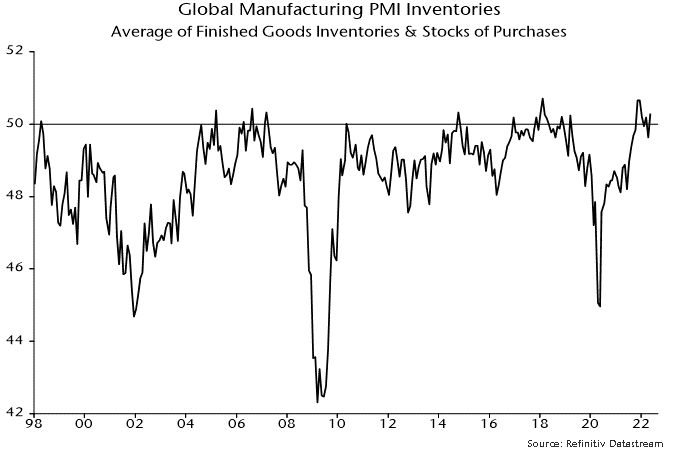
Recent news giving apparent support to the view that the global economy is displaying “resilience” includes May rises in new orders indices in the global PMI and US ISM manufacturing surveys. Both indices, however, are well down on three months earlier and the May recoveries were associated with further strength in stockbuilding – chart 3. A moderation of inventory accumulation – and likely eventual liquidation – will act as a major and sustained drag on order flow.
Chart 3
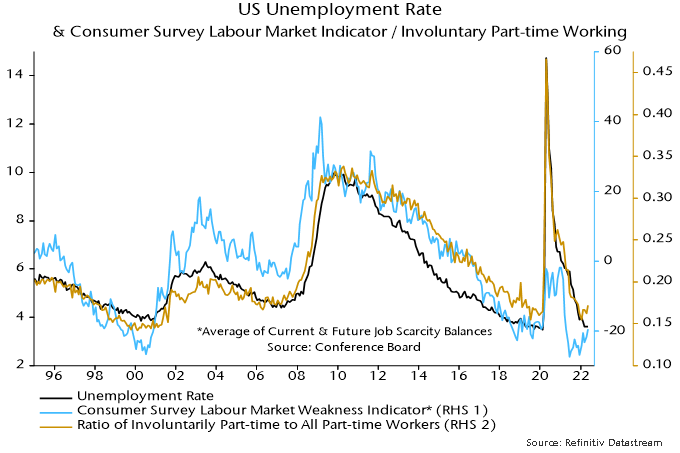
US payrolls growth beat expectations in May but alternative ADP and household survey employment measures have slowed sharply over the latest three months – chart 4. Meanwhile, weaker labour market responses in the Conference Board consumer survey and a rise in involuntary part-time working suggest that a sideways move in the unemployment rate in May is the precursor to an upturn – chart 5.
Chart 4
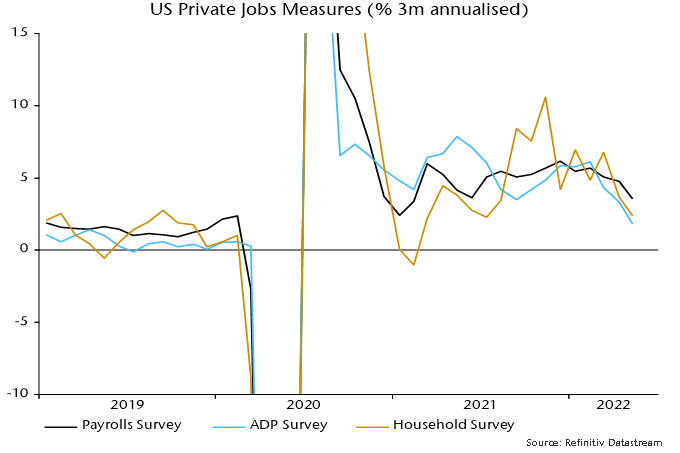
Chart 5