A post in August 2020 suggested that industrial commodity prices were about to surge. The stockbuilding (inventory) cycle appeared to be turning up from a Q2 2020 low, implying rising demand for raw materials, while strong global monetary growth was judged likely to amplify a price increase.
Monetary trends and cycle considerations are much less favourable now.
The preferred indicator here for tracking the cycle is the annual change in G7 stockbuilding expressed as a percentage of GDP (which approximates to the contribution of stockbuilding to annual GDP growth) – see chart 1. The cycle low in Q2 2020 suggested in the earlier post has been confirmed. If the current cycle were to conform to the average historical length of 3 1/3 years, the next low would occur in H2 2023.
Chart 1
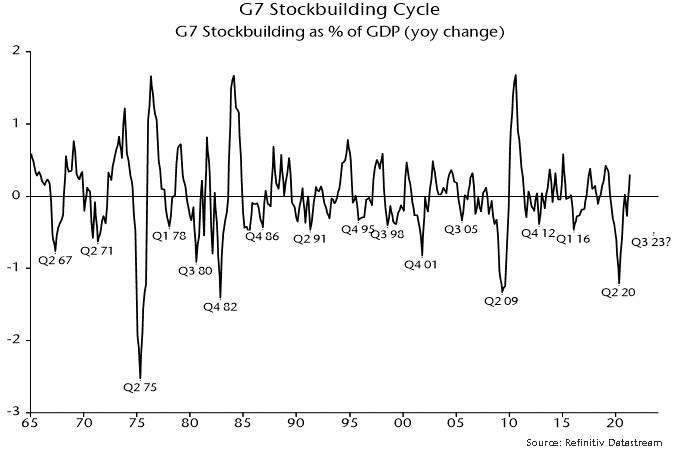
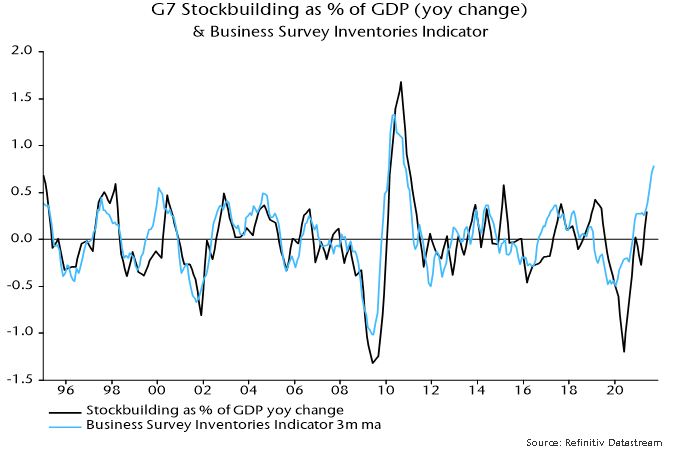
The most recent data point in the chart is for Q2 2021. Chart 2 shows a more timely business survey indicator, which has reached a level consistent with some previous cycle peaks. Any further boost to GDP growth from the cycle is likely to be limited and short-lived.
Chart 2
Industrial commodity prices are correlated with the stockbuilding cycle – Chart 3. In the 15 cycles since the mid-1960s (i.e. encompassing the lows from 1967 to 2016), the CRB raw industrials index* fell by an average 7% in the 18 months leading up to a cycle trough but rose by an average 14% in the subsequent 18 months.
Chart 3
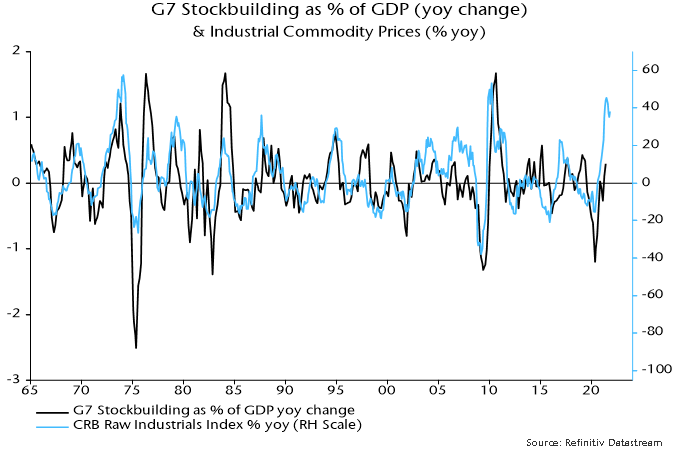
The increase since the Q2 2020 cycle low (i.e. almost 18 months) has been exceptional, at 55%. The bull market has been supercharged by “excess” money – created by monetary financing of fiscal deficits – chasing any assets displaying an outperforming trend. In addition, supply chain disruption has probably led to precautionary overordering of inputs.
A next cycle low in H2 2023 would suggest a decline in commodity prices starting in H1 2022. The fall during the downswing could be larger than average to compensate for an overshoot during the upswing.
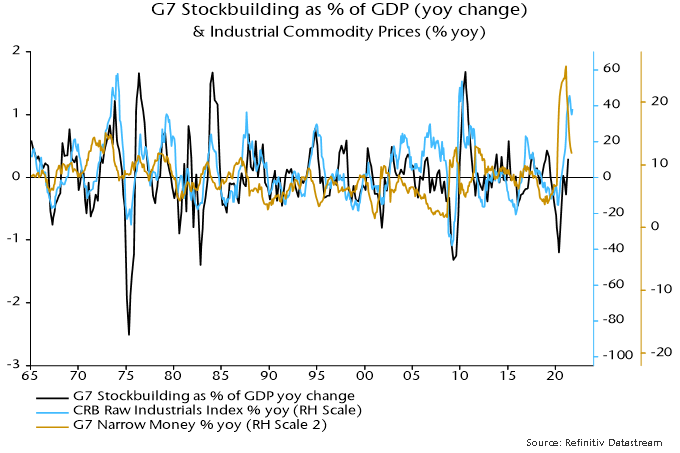
G7 narrow money leads both the stockbuilding cycle and commodity prices by about a year – chart 4. Annual money growth peaked in February 2021, suggesting a peak in annual commodity price inflation in early 2022.
Chart 4
What could delay a peak? The best hope is an early easing of Chinese monetary policy leading to a significant rebound in money growth that offsets slowdowns elsewhere. Recent comments from PBoC officials, however, showed no signs of urgency. Chinese stimulus may arrive too late to offset a drag on commodity prices as the G7 stockbuilding cycle rolls over.
*Includes burlap, copper scrap, cotton, hides, lead scrap, print cloth, rosin, rubber, steel scrap, tallow, tin, wool tops and zinc.