L’argent, le moteur des marchés
Eurozone monetary update: false hope from broad money
27 octobre 2022 par Simon Ward
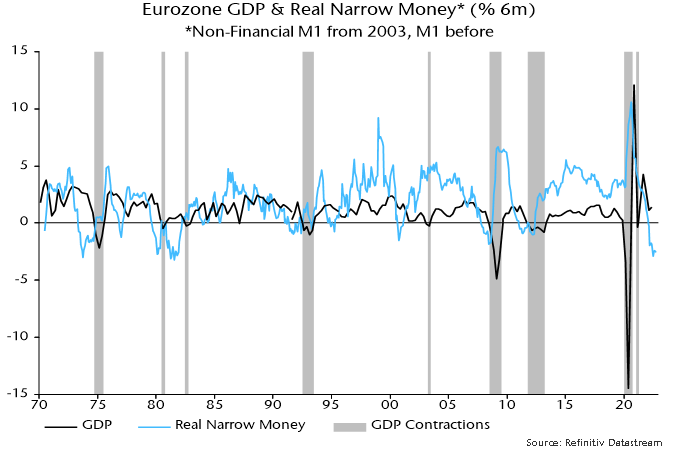
Eurozone money measures are giving mixed signals. Headline broad money M3 rose by a strong 0.7% in September, pushing six-month growth up to 3.3% (6.6% annualised), the highest since December. Narrow money M1, by contrast, contracted on the month, with six-month growth falling further to 1.8% (3.7% annualised) – see chart 1.
Chart 1
Broad money reacceleration, on the face of it, suggests an economic recovery towards mid-2023 after a sharp winter recession. The judgement here, however, is that broad money numbers have been boosted by technical / temporary factors and intensifying narrow money weakness is a better representation of current monetary conditions and economic prospects.
The six-month rate of change of real M3, it should be emphasised, remains negative, with consumer prices (ECB seasonally adjusted series) rising by an annualised 8.2% between March and September.
The sectoral breakdown of the headline M3 / M1 numbers, moreover, shows a significant recent contribution from rising money holdings of financial institutions. This probably reflects cash-raising related to weak markets and is not an expansionary / inflationary signal for the economy.
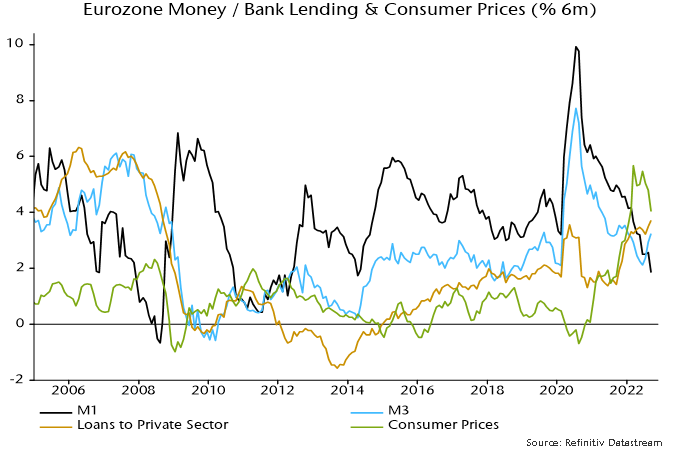
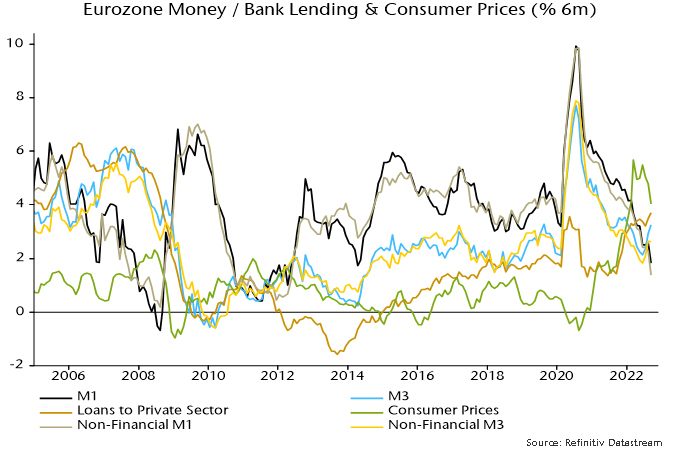
The forecasting approach here focuses on non-financial money measures where available, i.e. encompassing holdings of households and non-financial firms only. Six-month growth of non-financial M3 was 2.6% in September versus 3.3% for M3 and has shown a smaller recent recovery – chart 2.
Chart 2
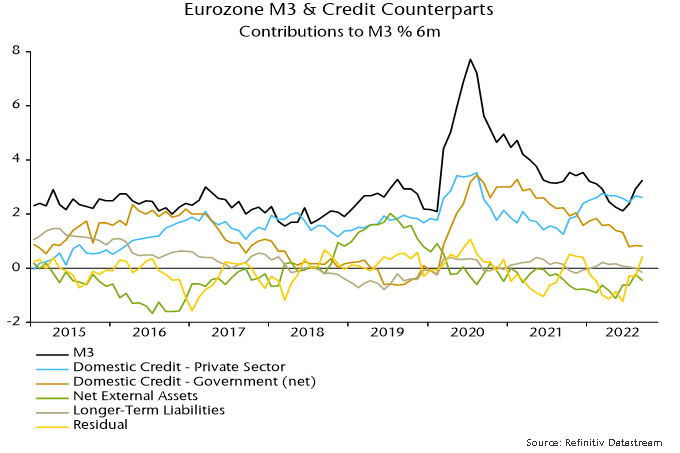
A further reason for playing down the broad money pick-up is that it is not explained by any of the conventional “credit counterparts” – credit to the private sector and government, net external assets and longer-term liabilities. The counterparts analysis shows a positive contribution from unspecified residual items, which behave erratically, suggesting a future reversal – chart 3.
Chart 3
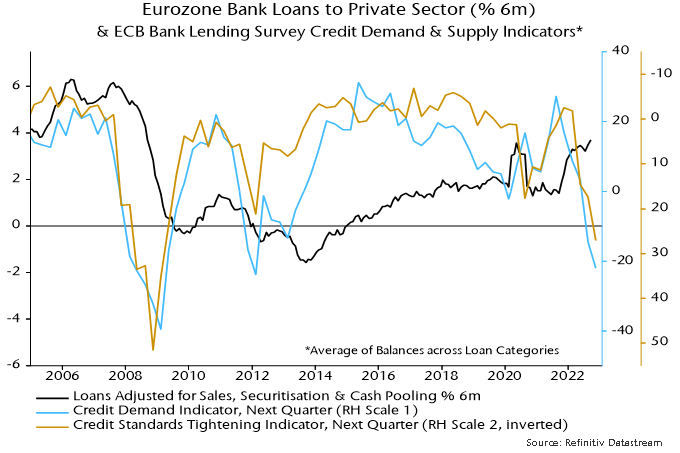
Solid growth of lending to the private sector has been the key driver of recent M3 expansion. The October bank lending survey, however, showed a further plunge in credit demand and supply balances, signalling a future lending slowdown or even contraction – chart 4.
Chart 4
Statistical studies show that real non-financial M1 has the strongest leading indicator properties of the various money and lending measures. Its six-month rate of change remains at the bottom of the historical range, suggesting no economic recovery before H2 2023 – chart 5.
Chart 5