Real Estate in Emerging Markets: Unlocking sustainable growth opportunities.

Emerging markets have had difficult times during COVID-19, however, we have seen that in several cases, the recovery has been faster than expected. Not only is this recovery due to higher vaccination rates, but also because of secular trends, especially in the emerging lower middle class where growth opportunities are just beginning. In our universe, one of the sectors where we see a great growth opportunity is in real estate. The main variables that drive tailwinds for the sector are:

  • Sustainable growth of the country, which implies that the emerging lower middle class can climb the ladder;  
  • Low interest rates, inflation, and unemployment; and
  • A consolidated industry with players who have good balance sheets and are focused on profitably.

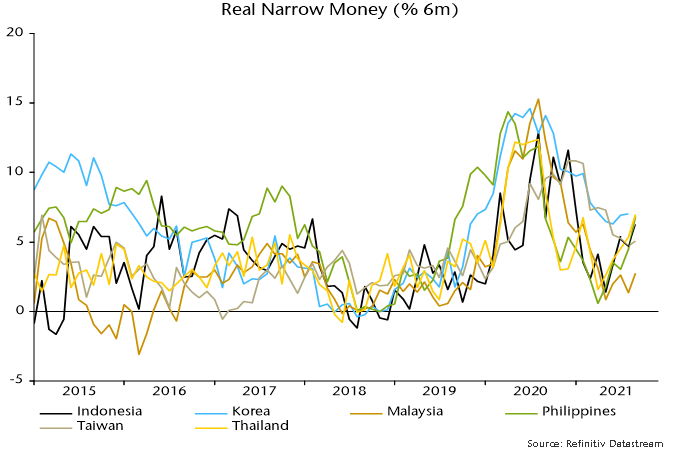
In this environment, our largest overweight in the real estate sector is in India and Indonesia. One could argue that interest rates and inflation are currently on the rise in many countries, which is true. However, the rate hike process in Asian countries has been much slower, and structural growth remains intact. For example, in the case of India, current mortgage rates are at record low levels of under 7%, compared to more than 10% a decade ago. Indonesia rates are also likely to maintain low, which continues to favour growth in the real estate sector.

India’s last real estate cycle ended in 2013 and has not been able to recover since, due to several disruptions, such as demonetization in 2016, the roll-out of the Real Estate Regulatory Act in 2017, and the Non-Banking Financial Companies (NBFC) crisis of 2018. Likewise, India hasn’t experienced real price increases since 2013. Prices have increased 3-4% on average, below inflation each year and also below growth in income levels of around 8% per capita. So, what would make this cycle effectively sustainable from 2021 onwards? Some of the reasons were explained above. Moreover, In India, the real estate sector has experienced an industry consolidation that has driven inventory reduction (around 20%). With rising demand (also boosted by additional space required driven by the work-from-home scenario) and shrinking supply, price increases are most likely to occur for the following years; a phenomenon we haven’t seen in India for the last decade. Some factors that have contributed to the real estate sector’s boom include low interest rates, rising salaries, and explosive hiring’s (i.e., Infosys has hired close to 350,000 employees this year and salary hikes have been close to 120%). With government support to housing such as stamp duty cuts by the government of Maharastra, or Gujarat government measures in December 2020 such as the possibility of agricultural land being acquired for affordable housing, this support has changed sentiment and boosted demand.

In relation to housing affordability, mortgage installments in relation to monthly income have also been improving, changing the sentiments with all the other more favourable conditions. For example, in Mumbai, this index has improved from 93% in 2010 to 61% in 2020. In cities such as Ahmedabad, the index has improved to 24% in 2020, from 46% in 2010. This means that in this city, an average household needs to spend 24% of its income to pay monthly installments for the respective loan. Mumbai remains the most expensive market, but levels are improving.[2]

Another relevant variable to monitor are launches and inventory. Companies need to increase launches overall in order to capture increasing demand in a sustainable way. In 2015 and 2016, launches were approximately between 475 and 501 million square feet, decreasing to 135 million square feet in 2021.[3] Launches decreased progressively during these years, essentially due to inventory levels being too high. Inventory months hovered around 40-45 days between fiscal year (FY) 2016 and FY2020, and lowered 40 days in FY2021. In noting this, companies reinforced their efforts to liquidate their inventory first, with prices barely increasing at a 1% compound annual growth rate (CAGR) over 2015-2021, far beyond inflation. Inventory levels have lowered to 916,195 units in FY2021, to the lowest levels in 7 years.[4] Moreover, as FY2021 was a COVID-19 impacted year, the decline in new launches was steeper than normal, as H1FY2021 was virtually a wash-out and H2FY2021 was all about monetizing existing unsold inventory.

Moving forward, we should expect launches to pick up again. We foresee that the most relevant Indian developers are well positioned to capture this window of opportunities, considering good cost of funding, low leverage (as several raised equity during 2019-2020), liquidity access, lower inventory levels, and market share gains are likely to remain consistent due to the consolidation of the industry.

The real estate sector is behaving quite well in terms of volume increases, although sustainable price increases that can also mitigate the hike in raw material prices remain as a key challenge. The real estate market in India is very important for the country’s development as it is worth USD 150-180 billion, or 6-7% of the GDP, and is expected to reach 13% of the economy by 2025. It is the second highest employment generator in the country, after agriculture.[5]

In terms of the non-residential market, in 2019, the Indian office market closed with a record high of transactions, increasing by 27% to levels of 60 million square feet during the year. In 2021, new completions surpassed transactions for the first time since 2013. During FY2021 to FY2022, in the organized market, tech-related companies accounted for around 40% of office transactions in India, with renewed massive hiring and positive business forecasts anticipate their vacancy will remain low.[6]

We still can see some work-from-home effects lowering absorption levels, nevertheless, tech and other related sectors have lowered vacancies, which we expect to maintain at reasonable levels. Their expansion plans are also likely to improve net absorption. In the first nine months of 2021, transactions increased by 13% and completions by just 6% in relation to the same period last year, showing that the levels of activity are increasing to a great extent. Likewise, projects set for completion in 2021 and 2022 are pre-leased by multinational companies. Capitalization (cap) rates in key areas such as Mumbai remain very healthy at 6-8%. Economies, such as India’s, with a young workforce and without adequate infrastructure (possess separate spaces for work from home and also lacks air conditioning) favour a hybrid model, although with less working from home than in developed markets. Considering all the aforementioned, office demands and vacancies are expected to remain at healthy levels in the medium term. Bangalore, Mumbai CBD, and Pune maintain the lower vacancy levels in the main cities, hovering around between 5 and 10%.[7]

Prestige Estates Projects (PEPL IN)

In Indian real estate, Prestige Estates Projects is one of our key holdings. Over the last decade, the Prestige Group has firmly established itself as one of the leading and most successful real estate developers in India across all asset classes. The company currently has its principal presence in South India (Bangalore) and is the main developer to boast such a widely diverse portfolio, covering the residential, commercial, retail, leisure, and hospitality segments. During 2HFY2021, Prestige signed a term sheet with Blackstone to divest its entire stake in six operational office assets (6.6 million square foot), an 85% stake in nine retail malls (3.3msf) and a 50% stake in four under-construction office assets (7.4msf), along with two hotel assets – Oakwood and Aloft. The enterprise value, as per the term sheet, was settled at Rs 92 billion, with a cap rate of 8.5%. Part of the transaction will be used to clear the debt of the company’s annuity portfolio while the remaining inflow is likely to be utilized for expanding a residential pipeline (new joint venture/joint venture development agreements) and also accelerating capex for the annuity portfolio. The yield on cost expected for the new developments is 15-20%, much higher than the cap rate of the sold portfolio. Prestige will have almost 0.2x net gearing after completing the transaction, which is much better than 1.5x before the deal, which can foster re-leveraging in new projects, giving much higher yields as recently explained.

The company is one of the few Indian real estate developers with sound geographical expansion projects, ready to capture many growth opportunities in the rising emerging low-middle class. They are characterized for their good track record in Bangalore in terms of their execution and expansion capabilities. Prestige has almost doubled its sales since 2005 and has done so every 4-6 years following, and we expect the expansion to continue with all the new projects in Mumbai. Such expansion makes the company one of the more geographically diversified developers in India and they are mainly focused in Mumbai, where opportunities are huge.

The company is setting up four office complexes in Mumbai – two in BKC: one at Mahalaxmi and one in Jijamata Nagar. They have not yet started pre-leasing any of them as they have yet to receive all approvals (construction has not yet started). All of these are prime office markets, and HDFC has been the lender in these projects prior to acquisition by Prestige, continuing to remain as the lender. These three projects are with a single local developer, DB Realty. This month, they also launched their inaugural residential project in Mumbai – Jasdan Classic, located in Byculla. Once entering the market, execution risks should be lower. Mumbai has a more “local” culture where a younger population, living in small apartments, favours a work-from-office philosophy.

Management raised FY2022 presales guidance from Rs 65 billion to Rs 70-80 billion, and targets reaching presales of Rs 100 billion in the next three years (from Rs 55 billion in FY2021) and rental income of Rs 28-30 billion per annum in the next 7-8 years (versus Rs 2.6 billion now). To achieve such growth, it is essential that the company invests in new project acquisitions and capex. In a period of five years, Prestige expects Mumbai sales to be around 25% of their consolidated revenues. Such an important figure outside its home region (Bangalore) is relevant for an Indian developer and can be the second most important diversification success case besides Godrej Properties. For the long term, their non-real estate portfolio could be transferred to a REIT.

In Indonesia, we have seen a massive rebound to robust presales and high take-up rates at launches, which implies that demand for property remains very high, whereas prices seem to have bottomed up from previous years. Launches during the year have performed well, being concentrated IDR two billion (with a tapering off of take-up rates, as prices exceed this level) and located within reasonable vicinities of large cities, fulfilling their roles as satellite suburbs serving the working population of a metropolitan area. The Government has also taken measures to boost the real estate sector. The main measure was to provide temporary rebates until December 2021, in value-added tax (VAT) for property purchases (up to 50%) if they are priced below INR 5 billion and 100% rebate if they are priced below INR 2 billion. However, developers are lobbying to extend this program into 2022.[8]

Another important issue was the relaxation on the loan-to-value (LTV) for developers. Similar to India, the last real estate cycle in Indonesia ended in 2013. Before that, leverage was not an issue for developers, as many of the properties were self-funded and banks were willing to issue mortgages for at least 80% of the value of properties. Some mortgages included some buy-back clauses from the developer, effectively protecting the bank in case of any default. After the 2013 boom cycle (which ended in 2015), one of the ways the Bank of Indonesia tightened up was by limiting LTV requirements. As a matter of fact, after 2013, for houses larger than 70 square meters, the loan-to-value was approximately 70% and 60% for first and second homes.[9] The LTV has continuously been relaxed between 2015 and in 2020, driven by a COVID-19 stimulus LTV of 100% (in practice, it is around 90%). Moreover, disbursements of funds to developers was also limited and linked to the construction progress. For example, prior to 2013, the disbursement for developers was 80% linked to the signing of the mortgage deed. In 2013, this percentage was reduced to 0%, in 2018 to 30%, and in 2021 part of the government easing measures was increasing this percentage to 100%.Such relaxations are very important for developers’ balance sheets, as construction costs hover around 50% of the selling price, helping significantly with the deleveraging of the sector.[10] 

Considering the aforementioned, we are assuming growth in presales of 45% this year, 38% of which occurred in the first nine months of 2021, and was positively impacted by the VAT exemption. We also expect 10-15% for 2022-2023, which would be the first multi-year growth after the decline between 2018 and 2020. We don’t expect price increases similar to those in the 2010-2013 cycle; nevertheless, there is a probable scenario next year for prices to start rising after seven years, if the COVID-19 pandemic ends favourably and structural demand stays intact. Despite some tough years, Indonesia’s real estate prices have been extremely resilient, avoiding any declines as developers have usually preferred to sell less volumes, while not making discounts.

In summary, we think the Indonesian real estate market is ready for another positive cycle, driven by a combination of developers’ efforts, such as better presales, capex discipline, providing housing financing through hybrid mortgages and in-house installments, together with favourable policies from regulators, such as declining debt costs, lower inventory costs and lower debt rates. Rates can hike in the medium term, but should remain low in relation to previous cycles. All of the abovementioned has helped the main developers to strengthen their balance sheets.

Another phenomenon we could start to see, especially next year, is a return from investors to the real estate markets. This situation is by far not comparable to the massive boom of the 2010-2013 cycle. In those years, yields where roughly 9-10%, and currently, they are around 5-6%, similar to a government bond yield. Nevertheless, banks’ liquidity remains very high (supported by high CASA growth), with very low LDRs, and together with strong balance sheets, most developers are good enough to continue to provide hybrid mortgages and in-house installments. This in turn will make easier roads for investors who can also expect some revaluation of their properties if the positive cycle continues.

Regarding launches, those done in August and September, post the latest mobility restrictions, were all sold out, which is a good indication of demand status. The amount of launches this year has been around 5,000 units.[11] In Indonesia’s case, we have seen a greater proportion of launches in relation to inventory cleanup in India. The main reason for this is that Indonesia’s property mix is more oriented towards landed house projects. New launches are done after most of the units are sold, and therefore, inventory is not a high concern. In order to continue growing, companies have been much more dependent on new launches, and demand has responded well.

After the cycle of 2013, the Bank of Indonesia’s double-tightening measures made developers look at external ways of financing. Hybrid mortgaging was one of the most common alternatives, being a combination of installment and mortgages, where there was an option to put a 30% down payment by instalments of up to 36 months. At the end of period, the buyer has to pay the remainder of the purchase, which can be done in cash, but this is usually done by mortgage. For the developer, as the house is under construction, these instalments are booked as liabilities as customer advances. Considering down payments are usually the hardest milestone for homebuyers, hybrid mortgages have helped their affordability. Extended down payments can also improve the buyer’s approval rates for loans because they provide more time for buyers to improve their credit profile, and also lower their LTVs. Currently, this mechanism is used in a lower extent, considering required down payments are lower (10-15% as market conditions have improved).

Regarding non-residential real estate, mall and office owners have begun reducing rental discounts, as traffic and occupancies have been recovering, and are likely to continue accelerating. Majority of shopping centres started the year with an average discount to tenants of 50%, and after the reopening in the third quarter, foot traffic recovered much more quickly than expected, so the discount has been lowered to 40%. By the second half of next year, it is most likely that we should see pre-COVID-19 rental income for malls. The office market has continued under oversupply since 2014, thus rents are not expected to rise, while also considering the work-from-home environment.

Ciputra Development (CTRA IJ)

One of the primary beneficiaries of the property market recovery in Indonesia is our holding Ciputra Development. Ciputra Development is one of Indonesia’s leading property developers, and is involved in both residential townships, as well as mixed development. Landed houses account for a major portion of Ciputra’s projects. The company also develops and operates a range of investment properties (i.e., malls, hotels, hospitals, and offices). In 50% of its projects, Ciputra employs an asset light business model, with revenue/profit share agreements with various local developers, providing the company with additional development opportunities in a balance sheet efficient manner. It currently has over 75 projects in 33 cities across the country. The company has one of the most extensive land banks in Indonesia (2,300 hectares), which implies over 15 years of assured developments and high margins in the medium term. This company fits very well in this article thesis about secular trends in emerging markets due to its huge potential in mid- and low-market segments, which are heavily underserved (total addressable market (TAM) of around 120 million people (middle-to-low income bracket), including 65 million millennials). The affordable housing business (average selling price (ASP) under Rs2 billion) has a massive potential, driven by the extensive population.

Ciputra is also tapping into geographical diversification across the major markets of the country, and has established developments in Greater Jakarta and Borneo, expanding to Semarang, Surabaya, Manado, Palembang and Makassar, currently present in 33 cities.

The urbanization trend (which has increased from 49% in 2009 to 56% in 2019) and the availability of mortgage facilities, represents strong tailwinds for the mid-long term. In relation to its residential business, even though the majority of its 55 residential projects are focused on low- to mid-income segments (65% of its 1H21 presales are priced at less than Rp 2 billion), 8 of its projects target upper income segments. In the commercial business, a Possible REIT or other method exit of portfolio of properties at good cap rates and re-allocation of capital at better yields on cost is always an alternative. Ciputra is enjoying a healthy 9M21pre-sales recovery over 33% year over year and 86% of the company’s target for the full year. For 2022 and 2023, we expect low-digit growth, with 2022 being very dependent when the VAT benefit will end.  Overall, Ciputra has superior margins, a good balance sheet, and low debt, and we expect the company to continue operating at strong levels.

In terms of recurring revenue (i.e., shopping centres, offices, and hotels), we expect it to contribute 18-19% 2021E and increase to 25-27% in FY2022-2023E. Recurring revenue brings stability to cash flows, and their normalization and acceleration in the following years is positive for the company and the stock. Ciputra expects normalization of tenant rates (to pre-COVID-19 levels) from FY2022 and its latest development, Surabaya mall, phase two, started reopening in the second quarter of 2021, where occupancy rates are expected to be around 90% by year end.

In emerging markets, it is important to be able to identify secular trends because it’s related to the fact that emerging lower-middle segments can gradually increase their purchasing power, well-being, and quality of life. However, in order to add value to our clients, we are constantly looking for the companies that can capture the best growth opportunities in this favourable environment. In this sense, we pay close attention to the quality of balance sheets, growth prospects, cash flow generation and management quality, among other things. Ciputra Development and Prestige Estates Projects are two good examples of quality companies enjoying favourable tailwinds.

Have a nice day.

The Global Alpha team


[2] Knight Frank Research

[3] ICICI securities and Liases Foras

[4] Jefferies presentation

[5] https://www.businessinsider.in/

[6] Knight Frank Research

[7] ICICI Securities and Cushman Wakerfield

[8] Just to quantify VAT Is 10% so the waiver for projects below INR 2billion is INR 200 MM, enough for buying a mid-high end car

[9] Mandiri

[10] Mandiri

[11] Citibank

The term “excess money” describes a monetary backdrop in which growth of the stock of money exceeds the rate necessary to support economic expansion. Excess money is associated with increased demand for financial assets and upward pressure on their prices, other things being equal.

Excess money cannot be measured directly. Two global proxies are followed here: the gap between six-month growth rates of real narrow money and industrial output; and the deviation of 12-month real narrow money growth from a slow moving average.

These measures have been strongly correlated with equity market performance historically. Between 1970 and 2020, global equities outperformed US dollar cash by 17.9% pa on average when the two measures were positive (allowing for reporting lags). They underperformed by an average 3.6% pa when one of the measures was negative and by 9.2% when both were.

The first measure remains positive despite a large fall in six-month real narrow money growth because of offsetting weakness in industrial output – see chart 1. Output growth has been held back by supply constraints and is likely to bounce back temporarily as these ease.

Chart 1

12-month real narrow money growth is estimated to have fallen below the slow moving average in October, turning the second measure negative – chart 2.

Chart 2

The long-term performance of equities / cash switching rules based on the individual measures has been similar. The second measure, however, has outperformed in the recent past – the associated rule recommended cash at the start of 2020, switched to equities in April and now suggests a move back into cash.

The rule associated with the first measure recommended equities in 2020 but switched to cash for several months in early 2021, reflecting a spike rebound in industrial output growth. Equities continued to climb during this period.

The lesson from this experience is that output volatility due to temporary non-cyclical factors – in this case the covid shock – should be discounted when using this measure. For example, the V-shaped fall and rebound in global industrial output during 2020 could (should) have been removed from the measure by using the alternative series shown in chart 3. An excess money measure incorporating the adjusted series indicated that the monetary backdrop remained favourable in early 2021.

Chart 3

These are the views of the author at the time of publication and may differ from the views of other individuals/teams at Janus Henderson Investors. Any securities, funds, sectors and indices mentioned within this article do not constitute or form part of any offer or solicitation to buy or sell them.

Past performance does not predict future returns. The value of an investment and the income from it can fall as well as rise and you may not get back the amount originally invested.

The information in this article does not qualify as an investment recommendation.

Marketing Communication.

As we approach the two year mark of COVID-19, there is little doubt of the impact this pandemic has had on how employees and managers think about life in the office. The onset of COVID-19 revealed that many businesses were ill-equipped to deal with going completely remote, investments in technology soared, and platforms Zoom, Teams, Slack and Webex became household names. In the early days, predictions from experts ranged from a revolution in our working lives to a return to normal within months. Individuals were quick to adapt by either buying homes, sometimes far away from the city, or renovating to create their own office space at home.

Managers and business owners were faced with answering new questions: how do you assess remote workers’ productivity? Who is liable if employees injure themselves at home? How late in the evening is too late to reach out to your employees? Now, with a significant portion of the developed world fully vaccinated and able to return to working from the office, we find that many of these questions are yet to be answered. However, we are starting to see some trends.

The peak of working hours spent at home in the United States (US) was over 60% in May 2020, a significant increase from less than 5% pre-COVID-19. It is estimated that current working hours spent at home are over 40%, indicating that the “remote-first” philosophy is still alive and well in many parts of the labour market. Numerous academic studies on the matter of productivity concluded that productivity was either equal or better when working from home, although the definition of productivity differs from one study to another. A survey by Statistics Canada found that roughly half of the remote workers reported completing as much work from home as they previously did in the office, and another third reported they got more done. One explanation for these results is that it is easier to focus on tasks at home than in the noisy office, where distractions can be plentiful. Another explanation focuses on the benefits of technological tools on teams’ coordination and effectiveness.

There is a risk, however, in having workers self-report on their productivity, as feeling more productive does not necessarily mean they actually are. Studies that did not rely on surveys often found mixed results. For example, in many cases, the increase in total productivity was the result of an increase in hours worked, which, is often not sustainable in the long term and might have other impacts on quality of life. In other pieces of research, the increase in productivity for standardized tasks increased, whereas innovation and more creative tasks were penalized due to a lack of interaction and exchange of ideas. Indeed, observers have noticed that virtual work led people to be “siloed” and interact mostly with a small group of their peers, compared to individuals working in the office. This reduction in contact among networks led to many inefficiencies that are not as easily noticed, but are just as damaging to the quality of output in environments that require a more creative and collaborative approach.

One of the more impactful downsides of working from home that many young professionals are not fully realizing yet, is related to career development. It is much more difficult to move up the corporate ladder without the in-person coffee chats or getting to be known around the office, and no amount of Zoom meetings with your supervisor can compensate for this. The counter-argument that promotions will be based more on merit and the work done as a result of work from home is idealistic at best. While output and knowledge of the business matters, managers tend to prefer promoting people they want to work with, therefore people who are not able to market themselves well will be penalized. Considering that many people who finished school in the last year and started their first job have yet to meet their colleagues in person, one can wonder if they will face the same long-term hurdles in their careers as recent graduates faced during the 2008-09 recession.

Given the current state of the labour market, employees seem to be holding the bigger end of the stick for now, and “remote-first” is likely to stay for some time. It is difficult for management to request that employees go back to spending 1-2 hours commuting every day when some of them are already getting unsolicited job offers from competitors and talent is difficult to attract. Working from home is now a perk and not a small one either. A widely thrown around number is that the average employee views being forced back to the office full time as being equivalent to a 5% pay cut. For companies already dealing with material and labour inflation, not forcing their employees back to the office is an easy way to retain and attract talent without exorbitant salary increases.

Now, going back to the usual question: how does Global Alpha get its exposure? We aim to obtain it through a few different angles.

IWG (IWG LN)

We have previously written multiple commentaries about IWG. IWG is a global leader in flexible workplaces with a portfolio of over 3,300 locations across 100 countries and known for its many brands, including Regus. Before COVID-19, the flexible office businesses only had a 5% market share, which is estimated to almost double over the next five years. The company saw its share price suffer at the onset of the pandemic, but has since then been lauded by investors as a strong play on the reopening and a true beneficiary of the modern hybrid workplace post-COVID-19.

Mimecast (MIME US)

Mimecast is a cloud-based platform that offers email security solutions ranging from targeted threat protection to large file sending services and data leak prevention. Mimecast benefitted significantly from the move to working from home as companies were looking to invest to modernize their cybersecurity architecture, and should continue to benefit as the corporate world has to strike a balance between work from home and on premise.

The push and pull we describe above between employers and employees is likely to outlast the pandemic by a long shot, and the resulting hybrid model will bear some difference to the pre-pandemic corporate model. Already, hot desking reservations are becoming the norm across bigger companies looking to downsize or optimize their space given their workforce will not return to the office full time in the near future. The standard 9-to-5 will become less standard as people are now set up to work from home and will have more leeway in making their own hours. Others will realize they need more human contact or a better split between work life and home life, thus will go back to spending a majority of their working time in the office. One thing is for sure: remote-only is not the new normal.

Have a nice day.

The Global Alpha team

The planet is 70% covered by water. Freshwater, which is what we drink and irrigate our farm fields with, represents 3% of the world’s water; two thirds of that number tucked away in frozen glaciers.

According to the World Health Organization (WHO), 33% of the global population finds water scarce for at least one month of the year, exposing them to diseases such as cholera, typhoid fever, and other waterborne illnesses, resulting in two million fatalities. At the current consumption rate, 66% of the world’s population may face water shortages by 2025. As these changes occur, water consumption will further become a strategic asset negotiated for agriculture, industrial use, and personal consumption.

Many coastal agglomerations have been able to plan personal water consumption with natural gas fueled desalination. This strategy can be onerous given the ongoing present energy crisis. Inland rural developments, which have exploded with COVID-19, are more affected by severe droughts. Australia is the poster child for this situation. Australians have been dealing with economy-changing droughts for decades and are already experts at rationing water. Rural expansion continues to be an important growth driver that further stresses the effects of droughts.

On August 16, the United States (US) federal government declared a Colorado River water shortage for the first time as water basins reached critical levels. This will have a material impact on agricultural goods in North America as the region produces a large percentage of winter crops. Companies with better water strategies will outperform.

Global Alpha holds Limoneira (LMNR:US), a leading citrus grower in California, a state that uses an excess portion of its share of the Colorado River. Their plantings are located in Ventura, Tulare, San Bernardino, and San Luis Obispo Counties in California and Yuma, Arizona and La Serena, Chile. The plantings consist of approximately 5,000 acres of lemons, 900 acres of avocados, 1,600 acres of oranges, and 1,000 acres of specialty citrus and other crops.

Unlike many growers, Limoneira owns important water rights, including rights on 17,000 acre-feet of water in California and 11,700 acre-feet of water sourced from the Colorado River, of which only 8,600 acre-feet are currently used for irrigation. The majority are categorized as priority rights, and these rights will increase in value as we start to restrict the usage of the Colorado River outflow.

Other North American Global Alpha holdings that play an important role in water distribution include Lindsay (LNN:US). The company pioneered crop irrigation with the Zimmatic pivot irrigation systems. We also own Primo Water Corporation (PRMW:US), the leading distributor of non-disposable drinking water in North America.

Continuing on crop performance, Global Alpha holds Sakata Seeds (1377 JT), an agriculture seed developer based in Japan. One of their leading technology efforts is developing seeds that can grow in arid environments. We also hold Horiba (6856 JT), which makes testing equipment, part of their environmental franchise. Also, water testing is set to grow in their portfolio of products.

Droughts not only affect crops but also hydroelectricity generation, which is notably 17% of China’s energy generation, 65% of Brazil’s, and 60% of Canada’s. Norway reached 95% of internal electrical generation (Statista 2021), enough for the country to recently complete large hydro export investments (PowerTechnology, 2021).

Norway had a grand scheme of being the green battery of Europe with its abundant water reservoirs to export electricity. These plans are on hold as droughts has dwindled the Norwegian water supply enough to exacerbate the European energy crisis. Hydroelectric power is critical to base load power.

Global Alpha holds Landys and Gear (LAND SW). The company is a key player in smart metering with the largest install base outside of China. We expect regulations to increase drastically in the future as water and electricity output become highly managed resources. Landys and Gear markets should continue to grow at an above-average rate.

More than a quarter of Australian homes collect and store rainwater for domestic use. It will become interesting how dry countries, such as Australia and Israel, can transfer their expertise to regions who are now experiencing droughts such as Western Europe.

According to a January 2020 report by Markets and Markets, the global smart water management market size is expected to grow to USD 21.4 billion by 2024, at a compound annual growth rate (CAGR) of 12.9%.

Desalination represents a potential solution to many water issues despite its negative environmental footprint from energy usage and residual effluent. Reverse osmosis is also reaching its limits in terms of performance. Inexpensive green power and desalination technologies are therefore required. The use of wastewater has also reduced the cost of desalination to $1,500 per acre-foot from $2,500. By comparison, a San Diego agglomeration needs to pay $1,200 per acre-foot for fresh water from the Colorado River.

Globally, more than 300 million people now get their water from desalination plants, from the Southwest US to China. The Middle East accounts for 47% of all desalination, while East Asia Pacific and North America hold 15% of desalination capacity.[3]

As we can clearly see, water consumption, agriculture, and electricity generation are key interlinked industries that can provide important growth drivers in our investment universe. As always, Global Alpha remains keen to benefit from these growing trends.

Have a nice day.

The Global Alpha team

Global manufacturing PMI survey results for October are consistent with the base case scenario here of a progressive loss of momentum through end-Q1 2022, at least.

PMI new orders have moved sideways for two months but export orders and output expectations fell further last month, to nine- and 12-month lows respectively – see chart 1.

Chart 1

A striking feature of the survey was a further rise in the stocks of purchases index to a 15-year high – chart 2. Stockpiling of raw materials and intermediate (semi-finished) goods has been supporting new orders for producers of these inputs but the boost will fade even if stockbuilding continues at its recent pace, which is very unlikely. This is because output / orders growth is related to the rate of change of stockbuilding rather than its level.

Chart 2

Chart 3 illustrates the relationship between new orders and the rate of change of the stocks of purchases index, with the coming drag effect expected to be greater than shown because of the high probability that stockpiling will moderate.

Chart 3

Stockbuilding of inputs has been particularly intense in the intermediate goods sector – chart 4. This suggests that upstream producers – particularly suppliers of raw materials – are most at risk from relapse in orders. Commodity prices could correct sharply as orders deflate – see also previous post.

Chart 4

A similar dynamic is playing out in the US ISM manufacturing survey, where new orders fell last month despite the inventories index reaching its highest level since 1984, resulting in a sharp drop in the orders / inventories differential – chart 5. The survey commentary attributes the inventories surge to “companies stocking more raw materials in hopes of avoiding production shortages, as well as growth in work-in-process and finished goods inventories”.

Chart 5

The combination of an ISM supplier deliveries index (measuring delivery delays) of above 70 with new orders in the 50-60 range has occurred only four times in the history of the survey. New orders fell below 50 within a year in every case.

The global PMI delivery times index (which has an opposite definition to the ISM supplier deliveries index, so a fall indicates longer delays) reached a new low in October but a recent turnaround in Taiwan, which often leads, hints at imminent relief – chart 6. The view here is that current supply shortages reflect the intensity of the stockbuilding cycle upswing, with both now peaking.

Chart 6

Bank of England Governor Andrew Bailey is under fire for miscommunication in the run-up to this week’s MPC meeting. A much bigger error was the Committee’s decision a year ago to boost QE by a further £150 billion at a time when annual broad money growth – as measured by non-financial M4 – was running at 11.7%.

The extra QE contributed to annual money growth rising further to a peak of 16.1% in February 2021, with the additional monetary excess to be reflected in a higher inflation peak in 2022 and a slower subsequent decline than would otherwise have occurred.

So should the MPC have hiked this week? Annual non-financial M4 growth was still 9.3% in September but the three-month pace of expansion has moderated to an annualised 4.9%, not far above a 2015-19 average of 4.5% – see chart 1.

Chart 1

The view here has been that the MPC should move rates back to 0.5-0.75% to reinforce the recent monetary slowdown and then wait for guidance from the numbers. Sustained sub-5% expansion would be consistent with (core) inflation returning to target, though probably not before H2 2023.

Higher rates would be needed in the event of a credit-driven rebound in money growth. Bank lending expansion has weakened recently, partly reflecting the ending of the stamp duty holiday, but expected loan demand balances mostly improved in the latest Bank of England credit conditions survey – chart 2.

Chart 2

The MPC’s miscommunication / delay risks triggering a fall in sterling, which would magnify near-term inflation difficulties. The exchange rate appears to have been boosted in 2019-20 by overseas investors increasing their net sterling deposits at UK banks – chart 3. These inflows stopped in 2021 but a large stock position could be liquidated if investors lose faith in UK policy-making.

Chart 3

Investing in Emerging Markets (EM) equities never gets boring. One of the main reasons why we love our job is that every day presents us with a dynamic set of challenges and opportunities. In our September 16 commentary, we discussed the crux of the ongoing regulatory changes in China from a local perspective, the impact on different sectors of the economy, and the steps we are taking to position our portfolio accordingly. However, China is not the only country in our investable universe where the government decided to step in and attempt to fix some areas where the free market’s invisible hand allegedly failed.

In August, we witnessed a regulatory crackdown on technology companies spread to South Korea. Many investors in that country reacted rapidly and rushed for the exits, likely spurred by their wounds sustained in China, where tech giants lost 30-50% of capitalization from their peak levels. As a result of the low tolerance of undergoing the same experience, they wiped tens of billions of United States dollars (USD) off the local tech titans’ market value.

Unlike the Chinese government ambitiously reshaping nearly every sector of their economy, the Korean regulators appear to be highly focused on addressing issues in the technology business. Leading internet platforms, both foreign and domestic, have been thoroughly scrutinized and repeatedly criticized by politicians from different parties for abusing their dominant market position and hurting competition in the pursuit of profits, aggressive expansionary business practices, personal data usage, and high commission rates, putting pressure on small and medium-sized enterprises (SME). For instance, Kakao is one of the leading Korean big tech companies, and until not so long ago was the third domestic company by market capitalization. Kakao started as a messaging platform and expanded into consumer finance, payments, gaming, and ride-hailing businesses, among others; with nearly 120 affiliates Kakao has been compared to an octopus by critics. While commenting on the topic, the leader of the ruling Democratic Party of Korea said, “Kakao must not follow the steps of the country’s other conglomerates that ignored fairness and coexistence in the sole pursuit of profit.”

Furthermore, some critics and lawmakers have advocated to adopt measures to prevent big tech companies from monopolizing online services, making it more difficult for larger platforms to acquire smaller peers. Senator Chung, from the People Power Party, suggested further enforcing the Telecommunications Business Act to restrict larger platforms’ M&A activities. He also pointed out that Korean internet is a winner-take-all market with quite grim consequences for the vanquished, likely reminiscent of the Netflix show Squid Game, as larger platforms have over 90% market share. Other lawmakers are pushing to allow smaller companies to gain access to user data accumulated by dominant platforms, creating an ecosystem where big tech companies and emerging operators can grow and innovate together and ultimately benefit consumers and the economy as a whole.

Let’s review the chronology of the main regulatory events:

One can argue that the upcoming March 9, 2022 presidential election in South Korea is the main reason why politicians are bringing up issues and bills targeting big tech companies. Coincidentally or not, five years ago, it was the family-run conglomerates (also known as “Chaebol”) that came under attack, and were accused of enriching themselves by abusing their dominance and applying unfair practices. Also, lawmakers traditionally pressured telecom companies on pricing plans as an efficient way to gain publicity.

Amid growing scrutiny and accusations from lawmakers and regulators, several big tech names pre-emptively announced action plans to appease critics by abandoning some business segments, providing support to SMEs and scrapping plans to compete with small mom-and-pop businesses. For example, Kakao announced their plans to withdraw from the hair salon, flower, snack, and salad delivery businesses. The company also created a $255 million fund for suppliers’ support in addition to other steps aimed at strengthening its corporate social responsibility.

Although the new rules announced by the government so far have limited impact on business fundamentals, the concerns of further regulatory tightening affected the market sentiment and put pressure on the technology sector. By and large, small-cap companies are less prone to the current regulatory headwinds as they usually do not exercise overwhelming market dominance, nor do they employ aggressive expansionary business practices similar to Kakao and Naver, and remain out of sight from the politicians and general public. Moreover, we believe some of our holdings are in a relatively safer position or can even come out as net beneficiaries when the dust settles.

NICE Information Service (030190 KS)

NICE Information Service is the leading credit bureau (CB) in Korea, providing consumer and corporate credit information, risk management consulting, and debt collection services. It has the largest number of members in both the financial and non-financial sectors. The company is poised to benefit from structurally higher demand for retail credit checks due to the ongoing expansion of near- and sub-prime markets, increased competition among Korean lenders (leading to higher turnover of existing loans), a greater focus on unsecured lending, deregulation (enabling more product launches), and retail customers (who are becoming increasingly careful about their credit scores).

NICE Information Service is the only CB in Korea with exposure to consumer and corporate fields, with the most robust financial big data capabilities accumulated over 30 years (database of 43 million consumers and 2.2 million corporates). It has also secured non-credit and non-financial data, such as telecommunication, rental, and social info by collaborating with numerous partners. Consumer CB and big data businesses are expected to be the primary growth drivers of the company. We believe NICE Information Service should be one of the primary beneficiaries of the lawmakers’ initiatives to allow smaller companies to gain access to user data from dominant tech platforms.

NKN KCP (060250 KS)

NHN KCP (“Korea Cyber Payment”) is the leading online Payment Gateway (PG) service provider with a 24% market share. PG is a settlement service that authorizes credit card payments for online retailers. It encrypts credit card information and sends transaction data directly to credit card companies, bypassing merchants’ systems, and thus keeping credit card information confidential. PG also withholds payment until the merchant fulfils the transaction, allowing online shoppers to avoid fraudulent sellers. NHN KCP also runs online and offline Value-Added Networks (VAN) and Online-to-Offline (O2O) businesses. Online VAN service, connects online merchants with credit card companies through secure communication networks to approve credit card transactions. Offline VAN service, connects offline merchants with credit card companies through secure communication networks to approve card transactions. The O2O business empowers SMEs and facilitates payment processing in offline channels.

NHN KCP serves over 150,000 domestic and global merchants. The company is one of the key beneficiaries of the ongoing structural growth of e-commerce and digital content consumption, credit cards’ share gains from other payment methods, and growing overseas transactions. NHN KCP provides Korean merchants with frictionless payment processing capabilities by charging highly competitive take rates (e.g., in the range of 0.10-0.12% for domestic PG). In general, the current PG take rates in South Korea are among the lowest globally and do not catch the eyes of lawmakers as being predatory. For instance, in the e-commerce business, Coupang charges its merchants take rates as high as 8-10%, which has been seen as taking advantage of mom-and-pop companies with no alternative. Also, the food delivery platforms charge take rates of 8-12% of total transaction volume. One of the main market concerns in the investment case of NHN KCP is the risk of its largest clients following the suit of eBay Korea and Naver Pay, to build their in-house PG capabilities and bypass third-party PG companies. The government push against big tech’s aggressive expansion in different verticals might cool down these potential intents and lower the risk of clients’ attrition for NHN KCP. Moreover, the company can gain extra business if one of the tech giants decides to outsource PG capabilities.

AfreecaTV (067160 KS)

AfreecaTV (“anybody can freely broadcast”) is the most prominent Korean live streaming platform, where anyone can broadcast gaming, sports, and various entertainment content free of cost. Instead of paying a subscription fee, the viewers show their appreciation by donating virtual gifts (Star Balloons) to broadcasters (Broadcast Jockeys or BJs). AfreecaTV takes 35% commission from these gifts donated to its BJs. In addition, it sells advertising products (branded content, banner ads, video ads and other solutions) to various brands. The platform has over 17,000 active BJs and hosts over 20,000 live streams per day. AfreecaTV is one of the few available options in the EM universe, providing exposure to e-sports. Gaming content drives over 60% of traffic, while around 30% of its gifting revenue and 50% of advertising revenue are derived from e-sports content.

The company enjoys a substantial supply of top BJs while supporting them financially and via collaboration in creating unique content and providing facilities for professional production and e-sports events. A BJ support department is available 24/7 and top BJs are locked in through exclusive agreements with AfreecaTV. A deep bench of highly popular broadcasters and exclusive content keeps its viewer base sticky. We expect the platform monetization to improve on the back of investments in content and BJ support. Rising content quality should drive a steady user base growth, enhance engagement, and lift the proportion of paying users and average revenue per paying user. In addition, AfreecaTV ad revenue is becoming the long-awaited second source of growth. It is poised for solid expansion, from nearly 20% of the mix to 50% in five years, primarily driven by branded content. Democratization of the data accumulated by large platforms can bring new opportunities for AfreecaTV’s ad business.

Have a great day.

The Global Alpha team

The strategy’s performance in the quarter was driven by three key factors:

  1. Reopening sensitivity in the retail and financial services portfolio in Indonesia and the Philippines as those economies emerge from their respective lockdowns as a result of a ramp up in vaccinations in the key economic centers.
  2. A re-rating of our Moroccan portfolio following the results of the parliamentary elections, which saw the long-dominant Islamist party (Justice and Development Party) suffer a major defeat at the hands of pro-business parties led by the Independent National Rally party.
  3. Positive reaction to a strong results season and upgraded guidance from some of the strategy’s largest portfolio companies including Integrated Diagnostics Holdings in Egypt and Jordan and Century Pacific in the Philippines.

In our last letter, we referred to an unnamed investment in the Philippines, which we can now reveal to be Wilcon Depot Inc., the largest home improvement retailer with 70 stores nationwide. Our investment in Wilcon was undeniably triggered by the reopening of the Filipino economy, which should unlock private building and construction activity, the main demand generator for Wilcon’s tiles, building materials, electrical and lighting, and paints lines. However, our thesis is built on a long term view of the company’s ability to leverage its scale, zero debt balance sheet, and management capacity to grow the overall market for home improvement and DIY retail, and consolidate shares from smaller and unorganized competitors who have been weakened by the Philippine’s dismal handling of the COVID-19 pandemic. Wilcon’s private label and exclusive lines are also a key element of its strategy to grow like-for-like sales and increase margins with the latter experiencing a step change (+200 basis points) in the last few quarters. This has been a key driver behind consensus upgrades as management affirmed this is the new level of profitability going forward. Wilcon’s management has done a solid job of managing the business in a very difficult environment through active SKU management, supply chain control, store network expansion, and investment in online channels.

In Morocco, the strategy owns two companies in retail and payments technology, sectors that should see real gains from the positive political picture that is emerging there. Morocco has generally been a very good market for the strategy as it benefits from political stability, low inflation, a stable currency, and a large domestic institutional liquidity pool that supports equity market valuations. The country has also been relatively successful in the handling of the COVID-19 pandemic. As travel resumes, Morocco’s large tourism industry should see a strong recovery (it represented approximately one fifth of the economy in 2019). The newly elected government has the technical and political capacity to execute on reforms that will likely only add to the investment case for Morocco and as such, we continue to be bullish on the strategy’s positioning there.

We are seeing earnings upgrades across a few of the strategy’s portfolio companies, which have also been supportive of the strategy’s recent performance. We highlight Integrated Diagnostics (IDH), the leading laboratory and diagnosis chain in Egypt, Jordan, and Nigeria, which posted exceptionally strong results in the first half of this year with revenue, operating profits and operating cash flows growing 1.4x, 2.9x, and 4.8x respectively versus the same period last year. This strong growth partly reflects a low base last year, but it is also a reflection of increased demand for COVID-19 related testing and the success that management has had in scaling its home testing services (i.e., collection of samples from home and sending test results digitally), which averaged out to 3.6k visits a day in the first half of the year. IDH signed a $45 million facility with the International Finance Corporation (IFC), which it can draw to fund inorganic growth on top of the approximate $80 million of cash on its balance sheet. We also expect IDH’s management to recommend an exceptional dividend once the year concludes given the strong cash generation this year.

We believe that the strategy is entering a strong earnings growth cycle underpinned by the reopening of economies, structural adoption of digital products and services that the portfolio is over-indexed to, innovation from aligned management teams in areas of product development and distribution, and operating leverage that will kick in on the back of sustainable efficiencies that portfolio companies have realised in the last 12-18 months. The strategy remains concentrated but geographically diverse, a reflection of a portfolio construction philosophy that is focused on generating returns from company rather than country/region and that favours long-term value creation over short term returns.

Vergent Asset Management LLP


DISCLOSURES

1. Unless otherwise stated, all data is at September 30, 2021 and stated in US dollars (US$). Source: Connor, Clark & Lunn Financial Group, Thomson Reuters Datastream.
2. Performance history for the Vergent Emerging Opportunities Strategy is that of the Vergent Emerging Opportunities Composite. The Composite has an inception and creation date of August 2018.
3. Net performance figures are stated after management fees, estimated performance fees, trading expenses and before operating expenses. Operating expenses include items such as custodial fees for pooled vehicles and would also include charges for valuation, audit, tax and legal expenses. Such additional operating expenses would reduce the actual returns experienced by investors. Past performance of the strategy is no guarantee of future performance; Future returns are not guaranteed and a loss of capital may occur. For illustrative purposes, performance fee of 20% on added value over the hurdle rate of 6% plus the management fee of 1.25% have been assumed. Actual management fees charged to a particular account may vary.
4. There is no benchmark for the Vergent Emerging Opportunities Strategy because it has an absolute return objective
5. Standard Deviation measures the dispersion of monthly returns since the inception of the strategy.
Benchmarks and financial indices are shown for illustrative purposes only, are not available for direct investment, are unmanaged, assume reinvestment of income, do not reflect the impact of any management or incentive fees and have limitations when used for comparison or other purposes because they may have different volatility or other material characteristics (such as number and types of instruments) than the Strategy. The Strategy’s investments are not restricted to the instruments comprising any one index and do not in all cases correspond to the investments reflected in such indices.
These materials (“Presentation”) are furnished by Vergent Asset Management (“Vergent”) on a confidential basis for informational and illustration purposes only. This Presentation is intended for the use of the recipient only and may not be reproduced or distributed to any other person, in whole or in part, without the prior written consent of Vergent. Certain information contained in this Presentation is based on information obtained from third-party sources that Vergent considers to be reliable. However, Vergent makes no representation as to, and accepts no responsibility for, the accuracy, fairness or completeness of the information contained herein. The information is as of the date indicated and reflects present intention only. This information may be subject to change at any time, and Vergent is under no obligation to provide you with any updates or amendments to this Presentation. This Presentation is not an offer to buy or sell, nor a solicitation of an offer to buy or sell any security or other financial instrument advised by Vergent. This Presentation does not contain certain material information about the strategy, including important risk disclosures. An investment in the strategy is not suitable for all investors, and before making an investment in the strategy, you should consult with your professional advisor(s) to determine whether an investment in the strategy is suitable for you in light of your investment objectives and financial situation. Vergent does not purport to be an advisor as to legal, taxation, accounting, financial or regulatory matters in any jurisdiction, and the recipient should independently evaluate and judge the matters referred to in this Presentation. Vergent Asset Management LLP is registered in England and Wales with its registered office address at 8th Floor, 1 Knightsbridge Green, London SW1X 7QA, United Kingdom (Companies House number OC418829) and is authorized and is an Exempt Reporting Adviser in the USA. It is regulated by the Financial Conduct Authority (FRN: 791909).
THIRD-PARTY DATA PROVIDERS
This report may contain information obtained from third parties including: Merrill Lynch, Pierce, Fenner & Smith Incorporated (BofAML), S&P Global Ratings, and MSCI. Source: Merrill Lynch, Pierce, Fenner & Smith Incorporated (BofAML), used with permission. BofAML permits use of the BofAML indices related data on an “As Is” basis, makes no warranties regarding same, does not guarantee the suitability, quality, accuracy, timeliness, and/or completeness of the BofAML indices or any data included in, related to, or derived therefrom, assumes no liability in connection with the use of the foregoing, and does not sponsor, endorse, or recommend CC&L Canada, or any of its products. This may contain information obtained from third parties, including ratings from credit ratings agencies such as S&P Global Ratings. Reproduction and distribution of third party content in any form is prohibited except with the prior written permission of the related third party. Third party content providers do not guarantee the accuracy, completeness, timeliness or availability of any information, including ratings, and are not responsible for any errors or omissions (negligent or otherwise), regardless of the cause, or for the results obtained from the use of such content. THIRD PARTY CONTENT PROVIDERS GIVE NO EXPRESS OR IMPLIED WARRANTIES, INCLUDING, BUT NOT LIMITED TO, ANY WARRANTIES OF MERCHANTABILITY OR FITNESS FOR A PARTICULAR PURPOSE OR USE. THIRD PARTY CONTENT PROVIDERS SHALL NOT BE LIABLE FOR ANY DIRECT, INDIRECT, INCIDENTAL, EXEMPLARY, COMPENSATORY, PUNITIVE, SPECIAL OR CONSEQUENTIAL DAMAGES, COSTS, EXPENSES, LEGAL FEES, OR LOSSES (INCLUDING LOST INCOME OR PROFITS AND OPPORTUNITY COSTS OR LOSSES CAUSED BY NEGLIGENCE) IN CONNECTION WITH ANY USE OF THEIR CONTENT, INCLUDING RATINGS. Credit ratings are statements of opinions and are not statements of fact or recommendations to purchase, hold or sell securities. They do not address the suitability of securities or the suitability of securities for investment purposes, and should not be relied on as investment advice.
Source: MSCI. The MSCI information may only be used for your internal use, may not be reproduced or re-disseminated in any form and may not be used as a basis for or a component of any financial instruments or products or indices. MSCI makes no express or implied warranties or implied warranties or representations and shall have no liability whatsoever with respect to any MSCI data obtained herein. This report is not approved, reviewed or produced by MSCI.

Additional monetary data confirm an earlier estimate here that global (i.e. G7 plus E7) six-month real narrow money growth fell slightly further in September, reaching its lowest level since August 2019 – chart 1. Allowing for the usual lead, the suggestion is that global industrial demand momentum – proxied by the manufacturing PMI new orders index – will weaken into end-Q1 2022 and possibly beyond.

Chart 1

Real narrow money is growing at a similar pace in the US, Japan, Eurozone and UK, i.e. there is no longer a monetary case for expecting superior US economic and asset price performance – chart 2.

Chart 2

Real narrow money growth remains relatively strong in Canada (one month behind), Australia and Sweden. Economic and / or inflation data have been surprising positively in all three cases, triggering policy shifts by the BoC and RBA – will the currently dovish Riksbank be next to capitulate?

Real money growth remains lower in the E7 than the G7, partly reflecting drags from Russia and Brazil, where monetary policies may have been tightened excessively – charts 3 and 4.

Chart 3

Chart 4

Money trends are perkier in EM Far East economies. Real narrow money growth remains relatively strong in Korea / Taiwan and has ticked up recently, while there have been notable rebounds in Indonesia, the Philippines and Thailand, partly reflecting reopenings – chart 5.

Chart 5

Will China be next? The worry has been that Evergrande fallout would lead to a tightening of credit conditions, aborting an incipient recovery in money growth due to modest policy easing since Q2. The October Cheung Kong business survey was hopeful in this regard: the corporate financing index (a gauge of ease of access to external funds) fell slightly but remains at a normal level – chart 6.

Chart 6

Monetarists have a straightforward response to the ongoing debate about whether global inflation is shifting to a permanently higher level: it won’t if global broad money growth reverts to its pre-covid norm.

While annual growth remains elevated, G7 plus E7 nominal broad money expanded at a 6.5% annualised rate in the three months to September, in line with the 2015-19 average – chart 7. Central banks won’t need to raise interest rates by much to contain inflation if this pace is sustained.

Chart 7

Money growth has slowed despite ongoing QE, suggesting a risk of an undershoot as these programmes wind down. The more likely scenario, however, is that a pick-up in bank lending provides offsetting support.

US commercial bank loan growth continues to firm, with the recovery underappreciated because of the distorting effect on headline data of PPP loan forgiveness – chart 8. The July Fed senior loan officer survey had signalled stronger credit demand; an October survey is due shortly.

Chart 8

The corresponding ECB survey has already been released and showed a pull-back in credit demand indicators, although they remain in hopeful territory – chart 9. Actual loan growth, however, has remained modest / stable.

Chart 9