Closeup side view of a mid 50’s couple going grocery shopping during coronavirus pandemic. They are in an empty aisle, wearing face masks and choosing some frozen foods.
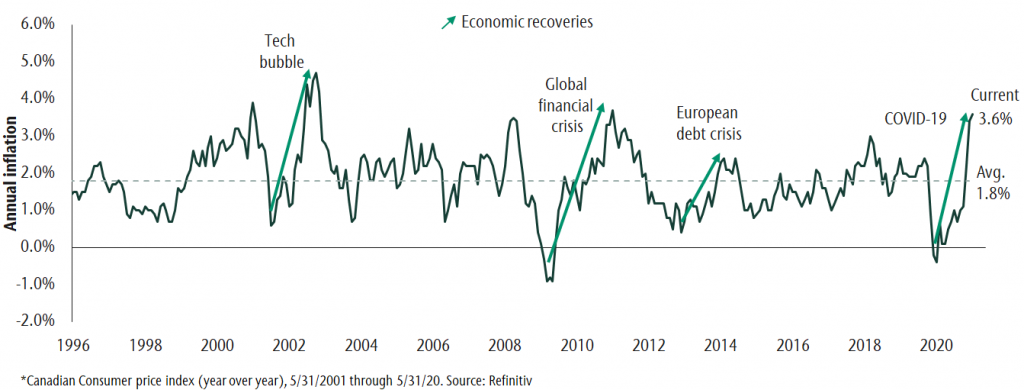
Inflation has moved to its highest level in ten years. Higher prices result from strong economic growth led by pent-up demand for goods and record levels of government spending. At the same time, strong demand is leading to supply shortages. This dynamic is normal and has occurred after every recession. Further, when we look at the components of inflation, we see that recent price increases are largest in industries hurt the most during the pandemic, e.g. energy and travel. These industries are cyclical and are pulling inflation readings higher as prices recover after a period of decline.
We don’t believe investors should be worried about longer-term secular inflation. Higher prices in the short term are expected to be tempered as supply adjusts and demand returns to more normal levels. And while policy actions such as higher spending and larger debt levels have increased short-term inflation, the same forces are deflationary long-term. This is because more money goes to paying down debt as opposed to future investment. The caveat is that higher debt levels encourage policymakers to allow inflation to move higher than it has been in recent cycles. Considering these forces, we believe inflation will be higher but not at the disruptive levels we saw in the 70s and 80s. Our long-term inflation expectation is for a 2.1% increase in prices. This is higher than the last 25 years but still moderate.
While we don’t think inflation will be disruptive in the long term, inflation is higher now and likely to be higher during the coming cycle. Now is a good time to consider the effect of inflation on different asset classes that make up your portfolio. Stocks can generally do well in a period of moderate inflation, whereas fixed income is hurt the most. Alternative asset classes also have some natural protection from inflation. Here follows our inflation perspective on each major asset class:
Equities
Moderate inflation is a double-edged sword for stocks. On the one hand it increases corporate cash flows and on the other it decreases the real value of investment returns. Companies with high valuations tend to underperform as their valuations are based on future earnings growth long into the future. In a period of higher inflation, these future earnings are now worth less today. Companies with lower valuations, companies we call value stocks, do better in a period of above-average inflation. Strategically we think it makes sense to hold both growth and value styles within your equity allocation.
In this environment we also want to own companies that can maintain their profit margins and offer specialized goods or services. These companies are more likely to be able to pass on rising business costs to consumers.
Fixed Income
The bond allocation of a portfolio is the one that is hardest hit by inflation. This is because most bond coupon payments do not increase with inflation. In addition, bond yields tend to rise when inflation is moving higher. The result is both a temporary decline in the price of bonds and lower long-term real return.
The negative effects of rising inflation and yields can be managed by holding short-term bonds and higher coupon bonds. The former are less sensitive to changes in inflation and yields. This protects capital when inflation is rising. The latter have more income to offset price declines. Having a view of the economic backdrop and managing a bond portfolio’s sensitivity to changes in yields and inflation is important to delivering risk-adjusted returns. This is particularly true when inflation is on the rise.
Alternatives
The alternative asset classes in a portfolio are attractive since they generate strong levels of income relative to traditional equities and bonds. They also tend to be the least sensitive to risks in the broader economy, including inflation. Each of our private market investments (real estate, infrastructure and private loans) have natural inflation stabilizers. For real estate, rental income tends to rise with inflation and most of our infrastructure contracts have ongoing inflation adjustments. Finally, the coupon payment on private loans are variable and income rises as yields and inflation move higher.
Hedge strategies are a liquid alternative asset class. They don’t directly hedge against inflation, but when allocating to strategy within a portfolio, we reduce bond exposure which is most negatively affected by inflation.
Planning for different investing environments
A well-diversified portfolio by its nature has many offsets to inflation. As active managers we also make investment decisions to improve portfolio returns or mitigate inflation risk. While it’s been a long time since we have had to worry about inflation, we are positioned for higher but moderate price increases. When reviewing your asset allocation, a key point to keep in mind is that inflation does not affect all portfolios equally. More conservative investors with a larger percentage of their portfolio in fixed income are more susceptible to lower returns as inflation rises. As such, it’s important to review the asset allocation on an ongoing basis to see how trends like inflation may impact the ability of a portfolio to meet your objectives. We have many tools to assess the tradeoffs you face as an investor under different market and economic conditions. While the future is uncertain, we can assist you in making informed decisions that consider risks like inflation, among others.
This post is for information only and is not intended as investment advice. The views expressed are those of the author at the time of publication and are subject to change at any time.
We recently conducted interviews with a number of holdings, including Royal Unibrew, Autogrill, and Soitec, and found it notable that most management teams we spoke with mentioned the improving pace of the recovery. European companies continue to acknowledge inflation, but many seem to argue that a combination of price increases and cost cutting can mitigate the impact. Looking the at Corporate Social Responsibility (CSR) agendas of these companies, their sustainability initiatives continue to improve. With the energy transition and digitalization as a source of growth, European companies could be beneficiaries of a new stimulus package.
The EU Recovery Fund is an important tool for the economic and political perspective in the EU. For the first time, the EU will be able to borrow large amounts for budget purposes. While the larger EU economies are likely to receive more in nominal terms, countries with lower per-capita GDPs should be the biggest recipients. The EU Recovery Fund, which will finance part of the energy transition plan, became the key financial pillar of the EU’s Green Deal. As a reminder, the objective of the EU Green Deal is to achieve climate neutrality by 2050 and to further reduce greenhouse emissions by 2030.
Some industries should benefit from that spending program, particularly the capital goods, construction, automotive, and utilities focusing on renewables. The digital transformation objective should drive some IT services and telecommunications companies, especially the ones exposed to 5G, rural connectivity, digitalization/modernization, e-heath, smart cities, and connected education.
We believe that the EU Recovery Fund will be supportive for the European equity market. This, combined with an acceleration of the vaccination campaign, could explain some of the recent catch up of EU equities. Let’s hope that the funds will be used in full and spent wisely over the next few years.
The sharp rise in UK CPI inflation to 2.1% in May supports the long-standing forecast here of a move above 3% in late 2021.
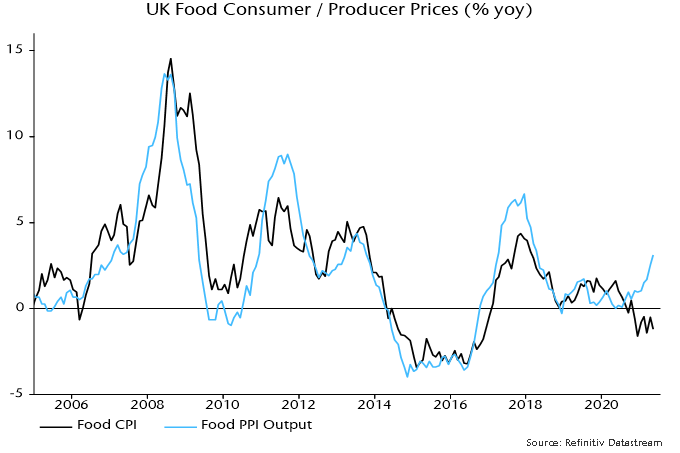
The 2.1% outturn compares with a 2.0% forecast in a post a month ago but there were bigger surprises within the detail. Core inflation – excluding food, energy, alcohol and tobacco – jumped from 1.3% in April to 2.0%. This was partly offset by unexpected further weakness in food prices, which posted a 1.2% annual fall, up from 0.5% in April.
This is an unfavourable combination because the rise in core prices is more likely to stick, with food prices expected to pick up into 2022.
A food rebound is already evident in producer output price inflation for food products, which rose to 3.1% in May and correlates with / leads CPI food inflation – see chart 1,
Chart 1
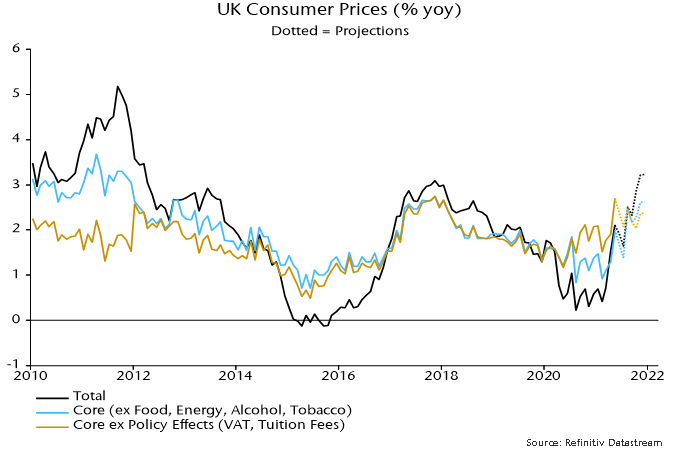
Headline / core inflation rates are still being suppressed by last year’s VAT cut for hospitality, which is due to be reversed in two stages starting in October. The guesstimate here is that core inflation would be 2.7% in the absence of the cut, based on an assumption of 35% pass-through to consumers.
The revised forecasts shown in chart 2 incorporate one-third of the upside core surprise in May, attributing the remainder to temporary “noise” – this may prove overoptimistic. As before, annual food inflation is assumed to rise to 2.0% by year-end. The previous energy price assumptions are also maintained.
Headline / core rates fall back in June / July because of base effects but rises resume thereafter, with headline inflation reaching 3.2% in November / December.
Chart 2
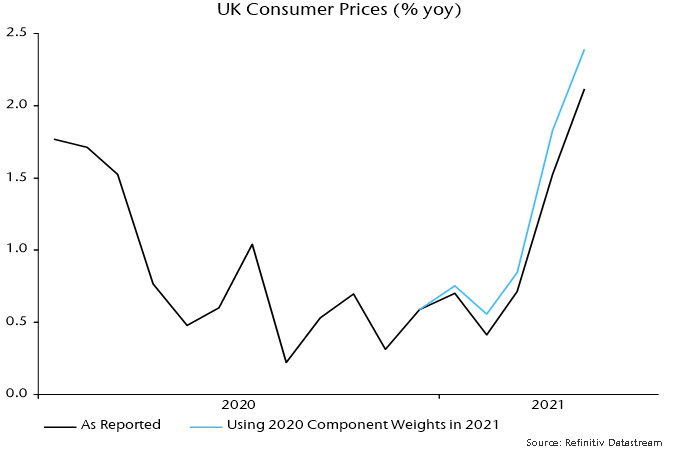
It should be noted that the end-2020 basket reweighting has had the effect of suppressing recorded inflation in 2021. The new weights reflect spending patterns during the pandemic but expenditure shares are normalising as the economy reopens, with an associated shift in relative prices.
The CPI weight of restaurants and hotels, for example, was cut from 11.9% in 2020 to 8.7% in 2021 but the price index for the sector rose by 3.4% between December 2020 and May, more than double a 1.5% rise in the overall CPI. The cut in the weight also implies that the VAT reversal will have a smaller CPI impact than last year’s reduction.
An alternative approach, which may better reflect consumer experience, is to reuse the 2020 basket weights, based on 2018 spending shares, for the 2021 index calculation. The alternative measure rose by 1.7% between December and May, with its annual increase at 2.4% versus the official 2.1% – chart 3.
Chart 3
The beauty industry is one of the oldest in the world. For centuries, we have debated the true nature and form of beauty; can it be objectively defined? Or is beauty truly “in the eye of the beholder,” as the saying goes.
Many great philosophers like Plato, David Hume, and Immanuel Kant have tried to define the term beauty, yet a universally valid definition remains elusive. There is, however, one thing most of us can agree on: appearance is the most visible aspect of beauty. Throughout the ages, men and women have striven to enhance their appearance – investing time, energy, and money in the pursuit of beauty’s closest cousin: attractiveness.
Historians can trace our use of beauty products and cosmetics back to 3100 BC, when the ancient Egyptians used kohl to create dramatic eyes. With today’s evolving technologies, we have moved from simple products such as eyeliner, to highly sophisticated serums, Botox, fillers, and laser treatments. And now, the cosmetic industry has moved far beyond the face, offering beauty-seekers a wide variety of non-invasive products and procedures for the entire body.
COVID’s unexpected impact on the beauty business
Since the start of the COVID-19 pandemic, face masks have been mandated across the globe. Over time, we’ve gotten used to wearing them and seeing them on others. But few anticipated how face masks could be a tailwind for the cosmetics industry.[1]
Cosmetic centres around the world have seen a large increase in demand for Botox injections and laser treatments, specifically around the eyes and upper portions of the face – the areas highlighted by the face mask.
Meanwhile, the massive boom in video-conferencing has generated a hyperawareness of facial “imperfections.” Confronted with endless hours of poorly-lit, unflattering reflections of ourselves on Zoom calls, many are investing in aesthetic procedures to enhance their appearance online.
The result? Soaring demand for deep-plane facelifts, resurfacing laser treatments, and other non-surgical procedures across the globe.
Everyone is looking for a beauty boost, a break from lockdown monotony, or a fresh face for the summer terrace. This week, we introduce you to InMode, a portfolio holding that should benefit from the booming beauty market.
Business Overview
InMode was founded in 2008 and is headquartered in Yokne’am, Israel. InMode is an esthetic equipment company that designs, develops, and manufactures minimally invasive (MI) and non-invasive aesthetic medical products.
InMode uses fractional radiofrequency, which allows a more precise delivery of energy to targeted areas of the body with only a small incision. Hence, it is more effective than other non-invasive procedures, offers much faster recovery, and has a lower risk profile than full plastic surgeries.
Their MI product line is used to perform procedures, such as liposuction with simultaneous skin tightening, body and face contouring, and ablative skin rejuvenation treatments. While their non-invasive products can help with procedures, like facial skin rejuvenation, wrinkle reduction, cellulite treatment, and skin appearance and texture.
Growth in the medical aesthetic industry is being driven by the following factors:
An aging population that wants to remain youthful
A flight to out-of-pocket work among doctors and clinicians
Growth of social media and video-conferencing
Growing availability of non-invasive and minimally invasive procedures
Improving efficacy
InMode’s Competitive Advantages
First mover advantage in minimally invasive aesthetic market, delivering surgical-grade results with no competitor in sight
Strong barriers to entry – patents, development timelines, global regulatory approval, and peer-reviewed published clinical data (56 articles)
Brand recognition, feedback from doctors, and a strong safety track record
Aligned management team with a proven track record and industry expertise
Growth Strategy
Product development, releasing 2 new platforms every year (ophthalmology and ENT in 2021)
Distribution in existing and new markets
Cross-selling (20% of clients purchase a second platform within 18 months)
Growth of consumables from current 10-12% to 25% in the MT
Management
InMode is led by an experienced team of entrepreneurs, who have seen a large market potential, given the treatment gap in the industry
Risks
The aesthetic laser and light-based treatment system industry is vulnerable to economic trends
Increased competition
Regulations could delay product launches
Global small cap companies like InMode are not always known by name, but they almost always touch our daily lives in important ways. As life slowly gets back to normal, you may notice a lot more flawless skin and toned bodies, as consumers take advantage of innovative medical aesthetic products delivered by market leaders like InMode.
Perhaps this gives new meaning to the saying — “beauty is skin deep”?
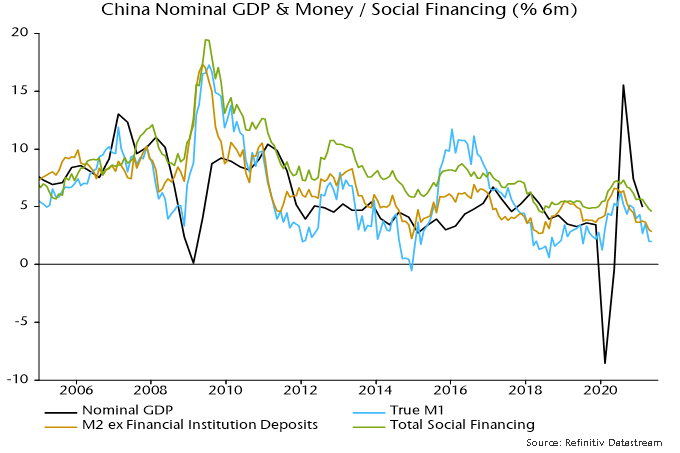
A case can be made that the most pressing monetary policy issue globally is the timing not of Fed tightening but rather of PBoC easing.
The mainstream view at the start of the year was that China would continue to lead a global economic recovery, resulting in a further withdrawal of monetary and fiscal policy support.
Chinese economic data have disappointed consistently – including May activity numbers this week – but the consensus has maintained a forecast of policy tightening, albeit later than originally expected.
The “monetarist” view, by contrast, is that the PBoC had already moved to a restrictive monetary stance during H2 2020. This was reflected in a money / credit slowdown late last year, which has fed through to a loss of economic momentum in H1 2021.
The PBoC was judged likely to recognise rising downside risks by easing policy by mid-year. Money market rates have been allowed to drift lower since February but May monetary data suggest that policy adjustment has been “too little, too late”.
Six-month growth rates of money and credit fell further last month, signalling likely continued nominal GDP deceleration through year-end, at least – see chart 1.
Chart 1
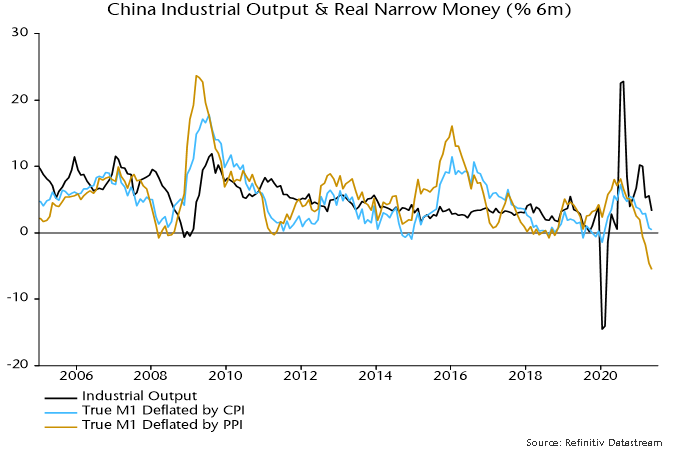
Weakness is more pronounced in real terms: narrow money has barely kept pace with consumer prices over the last six months and has fallen by 5.5% relative to producer prices – chart 2.
Chart 2
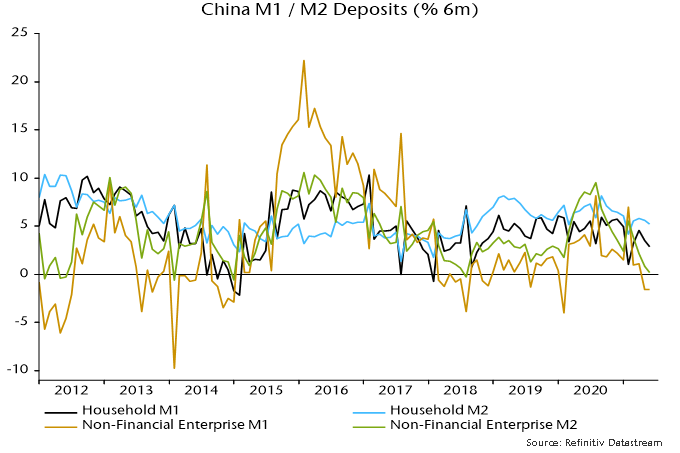
The liquidity squeeze is focused on companies. M2 deposits of non-financial enterprises have stagnated over the last six months, while M1 deposits have fallen – chart 3. Nominal weakness is comparable with 2014 and 2018 – ahead of major economic slowdowns – but real money balances are under greater pressure now, reflecting surging input costs.
Chart 3
The bias here has been to give the PBoC the benefit of the doubt and assume that easing would occur early enough to head off serious economic weakness. Increased pessimism is warranted unless action is forthcoming soon.
The surge in global broad money last spring and summer was expected here to result in a major inflation rise in 2021-22. A post in September presented reasoning supporting a forecast of 4-5% average G7 inflation in the two years to Q4 2022.
Recent data appear consistent with this forecast but monetary developments suggest that medium-term inflation risks are diminishing.
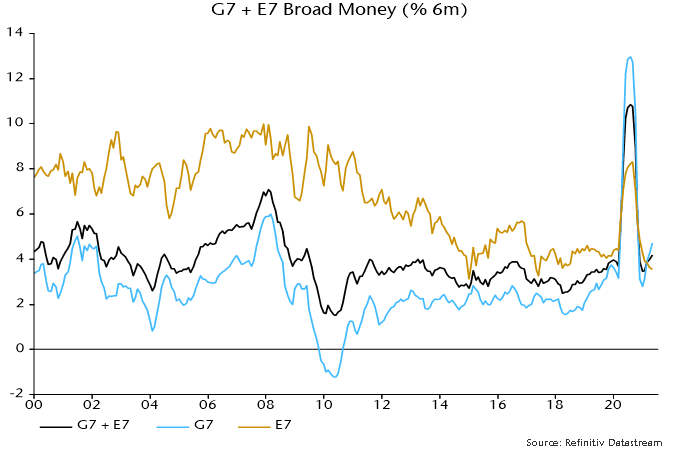
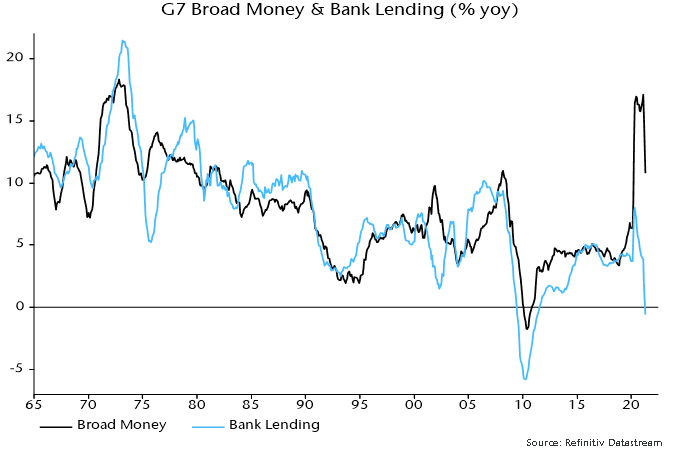
The latter assessment rests on three considerations. First, six-month growth of global (i.e. G7 plus E7) broad money has moved back towards its pre-pandemic pace. Growth was 4.2% in April, or 8.6% at an annualised rate, versus an average increase of 6.6% pa in the 10 years to end-2019.
G7 broad money growth remains elevated relative to the 2010s but E7 growth is at the bottom of its range, with Chinese weakness a key driver – see chart 1.
Chart 1
Secondly, G7 bank loans to the private sector have contracted following a brief spurt last spring, contrary to forecasts that government guarantee programmes and central bank incentives would spark a lending boom – chart 2.
Chart 2
Sustained high inflation in the 1970s reflected strong broad money growth driven by bank lending. Last year’s money surge, by contrast, was due to monetary financing of ballooning fiscal deficits and additional QE.
Bank lending is a coincident / lagging economic indicator and is likely to revive as economic activity continues to recover. “Excess” household and corporate liquidity, however, may delay and / or damp a pick-up in credit demand, while the impact on broad money may be neutralised by reduced monetary deficit financing / QE as fiscal positions improve and central banks taper.
A third reason for thinking that monetary inflation risks may have diminished is that a portion of the excess liquidity created last year has been absorbed – at least for the moment – by higher asset prices.
A simplistic quantity theory approach posits that the demand to hold money varies proportionately with nominal GDP. Money, however, is held as a store of wealth as well as to support transactions in goods and services.
Posts here last year described a modified quantity theory model in which nominal GDP and gross wealth have equal roles in driving broad money demand, with an additional impact from real bond yields. This model is consistent with G7 data over the last 50+ years and explains the secular decline in conventionally-defined broad money velocity as a consequence of a rising trend in the ratio of wealth to GDP and a fall in real bond yields.
The current stock of G7 broad money is 20% higher than at end-2019. G7 gross wealth – i.e. the aggregate value of equities, bonds and stocks – is also up by about 20% since then, while real bond yields, on the measure calculated here, are little changed. According to the model, the rise in wealth will have boosted broad money demand by 10%. So markets may have “absorbed” about half of the additional liquidity created since end-2019, implying a smaller excess to be reflected in goods and services prices.
The implication of the model that buoyant asset prices are disinflationary is controversial – it suggests, for example, that inflation prospects would worsen if markets were to crash. That was, however, the experience following the GFC – G7 inflation rose sharply in 2010-11 after the 2008-09 collapse in asset prices. High inflation in the 1970s was associated with weak markets, with equities volatile but directionless and a trend decline in bond prices.
The suggestion that the medium-term inflation outlook has improved at the margin is based on current information and will be revised if any of the inputs discussed above change.
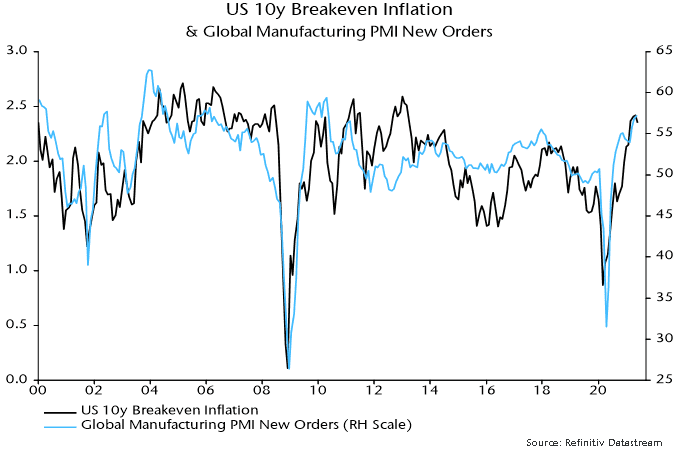
Medium-term inflation expectations in markets are correlated with swings in global industrial momentum – chart 3. The forecast here that the global manufacturing PMI new orders index will decline through late 2021 suggests that expectations will stabilise or moderate near term.
Chart 3
These are the views of the author at the time of publication and may differ from the views of other individuals/teams at Janus Henderson Investors. Any securities, funds, sectors and indices mentioned within this article do not constitute or form part of any offer or solicitation to buy or sell them.
Past performance does not predict future returns. The value of an investment and the income from it can fall as well as rise and you may not get back the amount originally invested.
The information in this article does not qualify as an investment recommendation.
Marketing Communication.
The Connor, Clark & Lunn Foundation (CC&L Foundation) is pleased to announce it has donated $25,000 to the Canadian Red Cross in support of India’s COVID-19 relief efforts. Funds will be directed from the Canadian Red Cross to the Indian Red Cross. The recent surge of COVID-19 cases in India caused a shortage of supplies and a strain on the health care system. Funds directed to the Indian Red Cross support COVID-19 response and recovery activities in India, as well as preparedness and resiliency activities for future pandemic and/or emergency events. Many employees at Connor, Clark & Lunn Financial Group and its affiliates call India home and have family and friends located in the hot spot areas. As the pandemic continues to create various uncertainties during these challenging times, we must continue to support those affected by COVID-19.
About the Connor, Clark & Lunn Foundation
Created in 1999, the CC&L Foundation is supported by CC&L Financial Group and its affiliates and it responds to requests from clients, staff and others to fund programs and not-for-profit organizations that help promote a better environment, improvements to education, advances in science and medicine, stronger communities and the arts.
Inflation has been at the centre of attention recently. The most recent core personal consumption expenditure data release, which excludes food and energy, was at a level not seen in decades. Despite this, the Fed has not acted yet, believing that it is transitory due to a combination of low base level and a challenged supply chain. With the economy transitioning from recovery to stability, and no tapering just yet, commodity prices look set to remain at current high levels. Therefore, the question is: are these current commodity prices also transitory, or are we going to enter a commodity supercycle?
A supercycle is hard to define, but can be generalized as a long-term period, usually greater than 10 years, where commodity prices are above their long-term trend. Supercycles are caused by an event that causes a significant increase in global demand. In natural resources, bringing a significant new supply, such as building a large mine or developing a new oilfield to the market (i.e., not just restarting idle mines or oilfields), can take years.
In the last century, there have been three commonly identified supercycles. The most recent was caused by the rapid industrialization of China that consumed raw materials at a pace that oil producers and miners could not keep up with. Before that, there was the oil crisis of the 1970s, which caused an increase in production costs for other commodities, hence lifting their prices. The third was related to rebuilding infrastructure after the Second World War.
Those who believe we are entering a supercycle point to governments needing to focus on job creation and stimulus post-Covid-19, rather than fiscal responsibility in the wake of the great financial crisis. They point to commodity-heavy infrastructure spending and green projects, such as the $2.3 trillion American Jobs Plan and Europe’s Green New Deal as evidence of this. Another reason why we could be heading for a supercycle is the lack of new or expansion projects that could respond to an increase in demand. Each supercycle is followed by an equally long period of low prices as demand wanes and new supply emerges. Recent years of low commodity prices have meant producers have spent less on exploration and production.
A contrasting opinion is that these commodity prices are more of a spike than entering into a new supercycle, with the recovery and fiscal response being the cause for the increase in commodity prices; this opinion is shared by the Fed. They believe this is not the structural change in demand needed for a supercycle and any increase in demand from the green energy transformation will be offset by slowing growth coming from China. Rather, they foresee sustained rallies in certain commodities more highly correlated to energy transition or electric vehicles and a limited new supply, such as copper, cobalt, nickel, lithium, and some rare earth metals.
Whether this is a short-term spike for commodity prices, or the start of another supercycle, Global Alpha has a diversified commodity exposure across its portfolios.
Westgold (WGX:AU) owns and operates three mining centres in Western Australia, a very favourable mining jurisdiction. These three operations have a throughput capacity of over 4 million tonnes per annum production capacity. The potential upside to throughput will come from the Big Bell mining operations, where production is set to go from 250,000 oz per annum to a long life 300,000 oz per annum average. Westgold has a solid balance sheet and will generate strong free cash flow as the company moves from an intensive capital spending phase.
Alumina (AWC:AU) is a leading Australian resource company with a specific focus on alumina, the feedstock for aluminum smelting. Alumina owns 40% of the world’s largest alumina business, Alcoa World Alumina and Chemicals (AWAC) JV with Alcoa. AWAC assets include bauxite mines and alumina refineries in Australia, Brazil, and other countries. AWAC also owns a 55% interest in an aluminum smelter in Australia. AWAC is the world’s largest producer of alumina and has a low position on the bauxite and alumina cost curves.
Aurubis (NDA:GY) is a leading integrated copper group and the largest copper recycler worldwide. The company produces over 1 million tons of copper cathodes per year, and from them a variety of copper products. Aurubis also produces precious metals, lead, nickel, tin, and zinc among other metals, as well as additional products, such as sulfuric acid. Aurubis has production sites in Europe and the United States.
Rayonier (RYN:US) is the second-largest timber REIT, with approximately 2.7 million acres located in strong softwood timber growing regions throughout the United States, primarily in the south with some operations in the Pacific Northwest, and New Zealand. What differentiates Rayonier is that they are a pure timber play – they do not own any pulp, paper or wood manufacturing operations.
Osisko Gold Royalties (OR:CN) is the fourth-largest precious metal royalty company in the world, with a North American focused portfolio of over 140 royalties, streams, and precious metal offtakes. Their main asset is a 5% net smelter return royalty on the Canadian Malartic mine, the largest gold mine in Canada. Osisko enjoys a diversified cash flow from 17 producing assets in low geopolitical risk jurisdictions.
Limoneira (LMNR:US) is one of the largest growers of lemons and avocados in the United States. In addition, the company grows oranges and a variety of specialty citrus and other crops. Demand for fresh citrus continues to grow steadily, driven by a growing middle class with disposable income and changing consumer preferences. Limoneira is vertically integrated due to its packing facilities, and its real estate portfolio could be another source of realizing value for shareholders.
Eagle Materials (EXP:US) is a leading supplier of heavy construction materials, such as cement, concrete and aggregates, and light building materials, such as gypsum wallboard in the United States. The company is a low cost producer, with between 30 and 50 years of raw material reserves. The majority of Eagle’s revenues are generated in markets where population growth, highly correlated to construction activity, is expected to be greater than the United States as a whole.
ARC Resources (ARX:CN) is a leading Canadian oil and gas company with high quality assets in the Montney region. After a merger with Seven Generations Energy, ARC is the Montney leader in production, land base, and condensate output.
Some forecasters expect global industrial momentum to receive a further boost over coming months from a rebuilding of manufacturing inventories. The assessment here, by contrast, is that the growth impact of the inventory cycle is peaking, although major weakness is unlikely until next year.
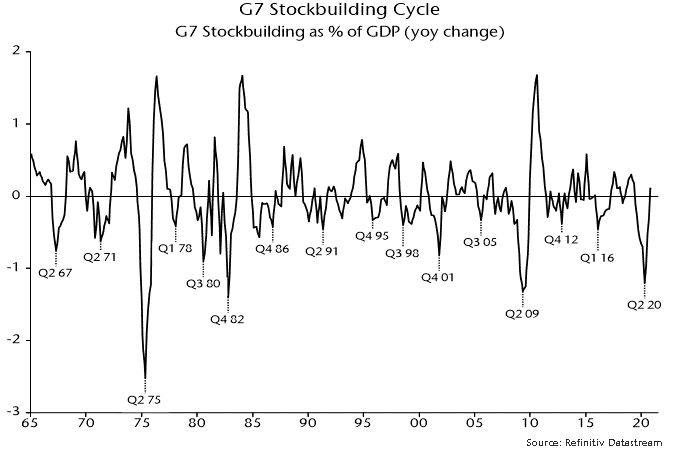
The stockbuilding or inventory cycle, also known as the Kitchin cycle, has an average length of 3.5 years – more precisely, 40 months – and is a key driver of overall economic activity and market behaviour. The history of the cycle is illustrated in chart 1, showing the contribution of stockbuilding to G7 annual GDP growth.
Chart 1
The cycle bottomed in April 2020, suggesting that the next low will occur around August 2023, based on the average 40-month length. This, in turn, would imply a cycle mid-point around December 2021 – seemingly supportive of the consensus view that that the growth impact of the cycle will remain positive in H2 2021.
There are three reasons, however, to doubt this interpretation.
First, the cycle usually peaks early after deep recessions. The maximum growth contribution topped out within five quarters after the 1975, 1982 and 2009 recessions, suggesting a current peak by Q3 2021.
Secondly, the current cycle could be shorter than average to compensate for a 50-month previous cycle, which was extended by covid shock, i.e. the current cycle could compress to 30 months, implying a mid-point around July 2021.
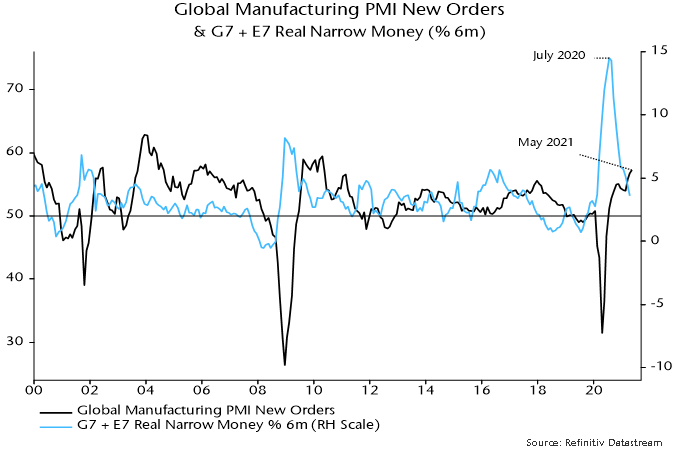
Thirdly, cycle peaks are signalled in advance by slowdowns in global real narrow money. Six-month growth of real money peaked in July 2020, with annual growth topping in January 2021.
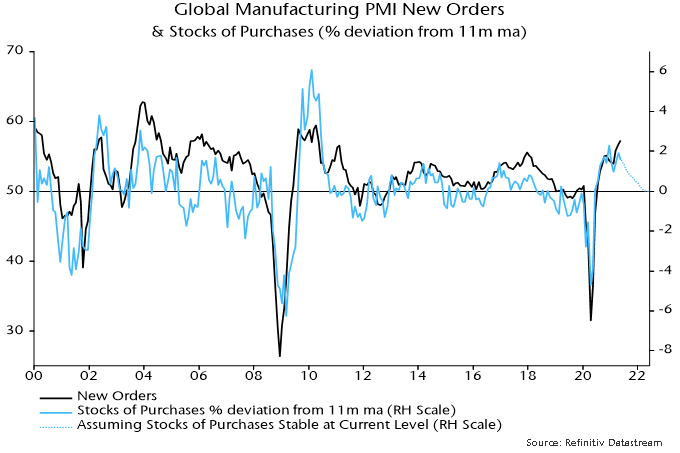
The view that the cycle will deliver a further significant boost is based partly on the low level of the global manufacturing PMI finished goods inventories index. However, the stocks of purchases index, covering intermediate goods and raw material inputs, is near the top of its historical range – chart 2.
Chart 2
Growth of new orders and output is related to the rate of change of stockbuilding. This is illustrated in chart 3, showing a significant correlation between the PMI new orders index and the deviation of the stocks of purchases index from a moving average.
Chart 3
This rate of change measure has already peaked and will decline further even if the stocks of purchases index maintains its current high level, as shown by the dotted line on the chart. For this not to occur, the index would have to continue to rise by 0.25 points per month, implying a move through its record high during H2.
Will the drag on new orders from a stabilisation or decline in the rate of increase of intermediate goods / raw material stocks be offset by faster accumulation of finished goods inventories. The assessment here is that the net effect will be negative, based on two considerations.
First, there has been a stronger historical correlation between new orders and the rate of change measure for intermediate goods / raw material stocks than the corresponding measure for finished goods inventories.
Secondly, the maximum correlation is contemporaneous for the former measure but incorporates a three-month shift for the finished goods inventories measure, i.e. finished goods inventories lag new orders by three months. So a rise in this measure over June-August would be consistent with a May peak in new orders.
The view here remains that the PMI new orders index will weaken through late 2021, based on the fall in global six-month real narrow money growth between July and April – chart 4. An early estimate of real money growth in May will be available later this week, assuming release of Chinese numbers.
Chart 4
A Herbal Renaissance
COVID-19 has been a stark reminder of human mortality, particularly in the countries where we invest. Poor health infrastructure, strained fiscal resources, and the large informal labour market are just some of the factors magnifying its profoundly negative impact. It is easy to forget our privilege as we sit at our home offices with Amazon orders keeping the doorbell busy and fresh food only a phone tap away.
The notion of immortality has fascinated humans for millennia. Since the scientific revolution, death has become a technical challenge over a divine one[1]. Medical and societal advances have lifted global life expectancy from 46 to 72 years in the space of five decades[2]. Humans today are looking to live better for longer. In his book Homo Deus, Yuval Noah Harari talks at length on immortality, proposing enhanced-sapiens as the next evolution of our species. Once we satiate our consumption needs and wants, which have their respective ceilings, what is next? Whilst advances in genomics, artificial intelligence and prosthetics are given the most attention, what is more immediately relevant, and more accessible for the majority, are incremental life adjustments and new habit formations in day-to-day life.
“Having raised humanity above the beastly level of survival struggles, we will now aim to upgrade humans into gods, and turn Homo sapiens into Homo deus.” – Homo Deus, Yuval Noah Harari
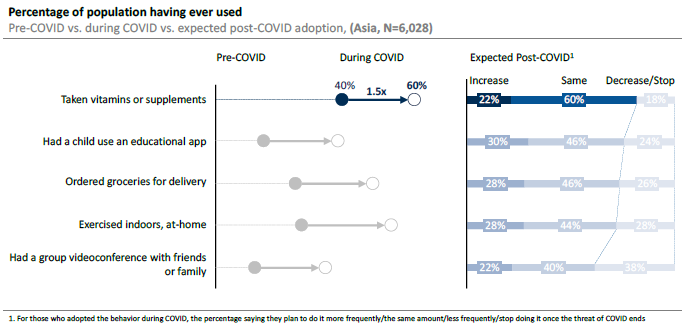
The pandemic appears to have accelerated the pursuit for healthier and better living, evident by an uptick in demand for better-for-you products, vitamins and supplements[3]. The global supplements market is estimated to be worth over $170 billion with the herbal sub-segment contributing $7.5 billion[4],[5]. The segment has grown on the back of heightened health and wellness considerations, enhanced expression of values in purchase behaviour and greater industry commercialisation. In developed countries, having saturated the margins of society, herbal and alternative medicines are now intertwined with more conventional Western practices. The ‘herbal influence’ is certainly visible in the fast-moving-consumer-goods (FMCG) industry, yet it is geared towards the premium end of the market. We believe this speaks to the idea that ‘herbal’ has, to some extent, become a heuristic cue for premium.
Vitamin and Supplement Consumption in Asia
We see a different picture in developing countries. In Asia specifically, we have witnessed more democratised consumption of herbal products and supplements as entrepreneurs, brand owners and even spiritual leaders have taken to formalising traditional remedies[6].
Source: L Catterton Asia Consumer Survey 2021
India is home to one of the best examples of this, with the modernisation and commercialisation of Ayurveda, an alternative medicine system, in everyday FMCG products[7]. Against the backdrop of rising Hindu nationalism and a democratisation of route-to-market accessibility, both local (Dabur, Himalaya, Emami, Marico and Patanjali) and multinational corporations (Nestle, Colgate, Unilever) have capitalised upon this structural trend. India has seen a culmination of factors, which together have propelled the segment to over $5 billion, with 76% of Indian households using Ayurvedic products for personal and health care needs[8]. COVID-19 has accelerated the growth of the Ayurvedic segment, not only for edible categories but also home and personal care items. India’s Health and Welfare Ministry even issued guidelines for recovering COVID-19 patients that included the consumption of Ayurvedic products.
Ayurvedic FMCG Products
Colgate is one of the many multinational brands that have capitalized on the growth in Indian alternative medicine market
In Indonesia, a market where we are invested, we have witnessed a similar trend. Increasingly consumers are allocating their marginal dollars to modern and branded versions of traditional remedies as well as products that more closely align with their religious and cultural identities.
Much like Ayurveda in India, Jamu is an ancient and indigenous form of care. It predicates that if ailments come from nature, their cure should too. Jamu comprises of a blend of tonics, ointments, oils and pills made from ginger, turmeric, tamarind, honey and other local spices found on the 17,000 island archipelago. Indonesians believe that these concoctions strengthen the immune system and serve as both a preventative and remedial solution to common illnesses. Historically, it was sold in traditional outlets, mainly by elder women (Jamu Gendong), sometimes in unhygienic conditions. According to the Ministry of Health, the Jamu industry is worth $2.7 billion and is consumed regularly by 49% of the 260 million population[9]. In contrast to Ayurveda however, Jamu has yet to benefit from the same global exposure, without a dedicated evangelist (see Baba Ramdev of Patanjali[10]) or full integration into mass market FMCG.
Conventional wisdom stipulates that Jamu is primarily consumed by elder generations, with younger, cosmopolitan consumers generally aspiring to international lifestyle products and wellness solutions[11]. What we have seen recently however, is a renewed interest in these traditional and herbal products as part of a longer-term trend. Jamu Cafes and Bars have emerged in Jakarta and there are dozens of companies that incorporate Jamu into both their edible and inedible products. The pandemic has also supported Jamu’s revived popularity amongst Indonesians[12]. President Joko ‘Jokowi’ Widodo publicised his morning Jamu routine and Dr. Chairul Anwar Nidom, Airlangga University, suggested drinking Jamu could boost immune systems. It seems as though global trends coupled with strong inherited tradition is leading to the growth of this budding industry.
Capitalising on the opportunity
One beneficiary of this herbal renaissance is our portfolio company, Sido Muncul (SIDO), a leading producer of herbal supplements in Indonesia. SIDO has built a business in modernizing a family recipe dating back to 1941; building a brand that now captures over 70% of its market. The company’s flagship product Tolak Angin is mainly used to treat ‘Masuk Angin’, a local ailment, but it is also taken to boost immunity[13]. Masuk Angin is not a medical term, but instead a colloquial term for the collective feeling of fever, chills, muscle ache and discomfort associated with the onset of what Westerners would call a cold. Its general applicability implies Tolak Angin is not limited to solving a single symptom, therefore use cases are plentiful.
The company is run by a professional team of third generation family members (who own 60%), complemented by seasoned executives in sales, distribution and finance. Regional Private Equity (PE) firm Affinity Partners took a stake in January 2018, and now hold 21% in the listed business. Affinity have supported management, whose natural strengths are in sourcing and production, by adding expertise in finance and logistics.
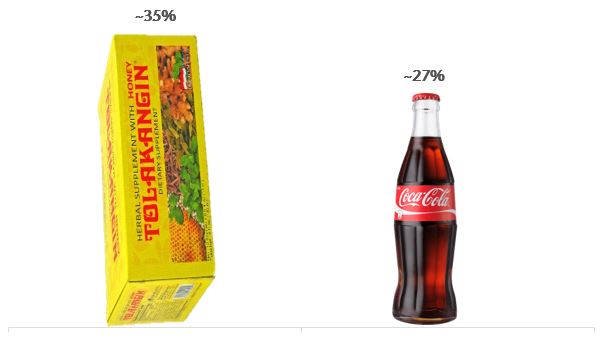
Sido Muncul Flagship Product – Tolak Angin
Source: Company
What is most striking (and attractive) about SIDO is the phenomenal margins it generates on Tolak Angin (+75% gross profit margins) which leads to a company level profitability profile that is far superior to even that of Coca Cola. Just like Coke, Tolak Angin has ultimate pricing power in its category and that is reflected in an approximate 20% premium on a per unit basis compared to its competitors. Unlike Coke, Tolak Angin does not have a strong second competitor and enjoys the benefits of being in a category that multinationals have found difficult to crack.
Operating Margin Comparison
Source: Bloomberg and Vergent analysis
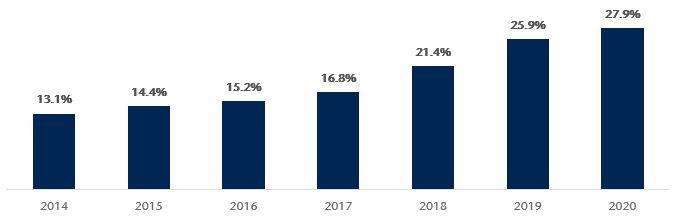
Return on invested capital more than doubled in the last six years as a result of SIDO scaling up manufacturing, optimising distribution, and making good capital allocation decisions. This has led to substantial free cash flow generation which management has been progressively paying out in dividends.
Return on Invested Capital (%)
Source: Vergent analysis
Despite the impressive revenue and profit margin performance to date, we see more growth for SIDO ahead. The company is now building on demand in the East of the country where per capita consumption is one quarter of that in Greater Jakarta. In addition, management have outlined an export strategy focused on the Philippines, Nigeria, Malaysia and Saudi Arabia where its products have an existing following. Building on the strength of the brand, the company is launching new higher value-added products through new formulations, formats and flavours. On the margins side, we see scope for further efficiency gains as factory utilisation improves, raw material pricing is standardised and the as innovation pipeline of high value products comes to market.
These materials (“Presentation”) are presented by Vergent Asset Management LLP <(“Vergent”)>. This Presentation is furnished on a confidential basis for informational and illustration purposes only. This Presentation is intended for the use of the recipient only and may not be reproduced or distributed to any other person, in whole or in part, without the prior written consent of Vergent.
Vergent Asset Management LLP is registered in England and Wales with its registered office address at 8th Floor, 1 Knightsbridge Green, London SW1X 7QA, United Kingdom (Companies House number OC418829) and is authorized and regulated by the Financial Conduct Authority (FRN: 791909).
This financial promotion is issued by Vergent Asset Management which is authorized and regulated by the Financial Conduct Authority (‘FCA’). Past performance is not indicative of future results. The value of your investment may go down as well as up and you may not receive upon redemption the full amount of your original investment.
THE PERFORMANCE PRESENTED HEREIN IS NOT INDICATIVE OF FUTURE RESULTS. The performance results contained herein are for informational purposes only, and are not meant to imply that Vergent’s trading programs will produce results similar to the performance results contained herein. There can be no assurance that Vergent or any account or product advised thereby will or is likely to achieve any results shown. There can be no assurance that such trading programs will make any profit at all or will be able to avoid incurring substantial losses. No representation is made that Vergent’s investment processes or investment objectives will or are likely to be successful or achieved.
Certain information contained in this Presentation is based on information obtained from third-party sources that Vergent considers to be reliable. However, Vergent makes no representation as to, and accepts no responsibility for, the accuracy, fairness or completeness of the information contained herein. The information is as of the date indicated and reflects present intention only. This information is subject to change at any time, and Vergent is under no obligation to provide you with any updates or amendments to this Presentation. The information contained in this Presentation is not complete and does not contain certain material information about the trading programs described herein, including important risk disclosures. Accordingly, this Presentation must be read in conjunction with, and is qualified in its entirety by, such other disclosure documentation as may be provided by Vergent from time to time in connection with a prospective investment. An investment in the strategy described herein may not be suitable for all clients, and before allocating any assets to the strategy or strategies, you should thoroughly review the terms and disclosures the strategy and consult with your professional advisor(s) to determine whether an investment in the strategy is suitable for you in light of your investment objectives and financial situation.
This Presentation may contain opinions pertaining to securities, financial products, transactions and investment strategies, and such opinions may differ from one to another. Any opinions, assumptions, assessments, statements, market commentary or the like (collectively, “Statements”) regarding past, current and/or future market conditions, themes, trends or events or which are forward-looking, including regarding portfolio characteristics and limits, constitute only subjective views, beliefs, outlooks, estimations or intentions of Vergent, should not be relied on, are subject to change due to a variety of factors, including fluctuating market conditions and economic factors, and involve inherent risks and uncertainties, both general and specific, many of which cannot be predicted or quantified and are beyond Vergent’s control. Future evidence and actual results could differ materially from those set forth in, contemplated by, or underlying these Statements, which are subject to change without notice. In light of these risks and uncertainties, there can be no assurance and no representation is given that these Statements are now, or will prove to be, accurate or complete in any way. Vergent undertakes no responsibility or obligation to revise or update such Statements. Statements expressed herein may not necessarily be shared by all personnel of Vergent. You acknowledge that you are capable of independently analyzing such Statements and the other information presented herein using your own expertise, due diligence and decision making, and you are solely responsible for any investment decisions made through your use of such Statements or other information and for any and all trading results achieved thereby, whether for your own account or on behalf of your clients.
This Presentation is not an offer to buy or sell, nor a solicitation of an offer to buy or sell any security or other financial instrument, or to invest assets in any account, advised by Vergent. An investment in any account advised by Vergent may be made only by qualified clients after receipt of formal investment management documentation and disclosures from Vergent, and only in those jurisdictions where permitted by law. Vergent’s investment strategies have management fees and operating expenses that would reduce returns to a client. Operating expenses include items such as custodial fees for segregated accounts and for pooled vehicles would also include charges for valuation, audit, tax and legal expenses. Such additional operating
expenses would reduce the actual returns experienced by investors in segregated accounts and pooled vehicles. Any client must be able to bear the risks involved in any potential investment and must meet the suitability requirements relating to its participation in the Trading Programs.
Financial indices are shown for illustrative purposes only, may not be available for direct investment, are unmanaged, assume reinvestment of income, do not reflect the impact of any management or incentive fees and have limitations when used for comparison or other purposes because they may have different volatility or other material characteristics (such as number and types of instruments) than the investment strategies described herein. Vergent’s investment strategies are not restricted to the instruments comprising any one index.
Vergent is not and does not purport to be an advisor as to legal, taxation, accounting, financial or regulatory matters in any jurisdiction. The recipient should independently evaluate and judge the matters referred to in this Presentation.
Net performance figures are stated after estimated management fees and transaction costs but before operating expenses. Operating expenses include items such as custodial fees for segregated accounts and for pooled vehicles would also include charges for valuation, audit, tax and legal expenses.
Third-party data providers
This report may contain information obtained from third parties including: Merrill Lynch, Pierce, Fenner & Smith Incorporated (BofAML), S&P Global Ratings, and MSCI.
Source: Merrill Lynch, Pierce, Fenner & Smith Incorporated (BofAML), used with permission. BofAML permits use of the BofAML indices related data on an “As Is” basis, makes no warranties regarding same, does not guarantee the suitability, quality, accuracy, timeliness, and/or completeness of the BofAML indices or any data included in, related to, or derived therefrom, assumes no liability in connection with the use of the foregoing, and does not sponsor, endorse, or recommend Vergent, or any of its products.
This may contain information obtained from third parties, including ratings from credit ratings agencies such as S&P Global Ratings. Reproduction and distribution of third party content in any form is prohibited except with the prior written permission of the related third party. Third party content providers do not guarantee the accuracy, completeness, timeliness or availability of any information, including ratings, and are not responsible for any errors or omissions (negligent orotherwise), regardless of the cause, or for the results obtained from the use of such content. THIRD PARTY CONTENT PROVIDERS GIVE NO EXPRESS OR IMPLIED WARRANTIES, INCLUDING, BUT NOT LIMITED TO, ANY WARRANTIES OF MERCHANTABILITY OR FITNESS FOR A PARTICULAR PURPOSE OR USE. THIRD PARTY CONTENT PROVIDERS SHALL NOT BE LIABLE FOR ANY DIRECT, INDIRECT, INCIDENTAL, EXEMPLARY, COMPENSATORY, PUNITIVE, SPECIAL OR CONSEQUENTIAL DAMAGES, COSTS, EXPENSES, LEGAL FEES, OR LOSSES (INCLUDING LOST INCOME OR PROFITS AND OPPORTUNITY COSTS OR LOSSES CAUSED BY NEGLIGENCE) IN CONNECTION WITH ANY USE OF THEIR CONTENT, INCLUDING RATINGS. Credit ratings are statements of opinions and are not statements of fact or recommendations to purchase, hold or sell securities. They do not address the suitability of securities or the suitability of securities for investment purposes, and should not be relied on as investment advice.
Source: MSCI. The MSCI information may only be used for your internal use, may not be reproduced or re-disseminated in any form and may not be used as a basis for or a component of any financial instruments or products or indices. MSCI makes no express or implied warranties or implied warranties or representations and shall have no liability whatsoever with respect to any MSCI data contained herein. This report is not approved, reviewed or produced by MSCI.